8 Using Stats iQ
This guide is a work in progress, and will be updated substantially as time allows. If you find an error, please let us know.
8.1 Data & Analysis
From your survey, you can navigate to the Data & Analysis tab to view your data. Using a campus-wide account, this tab contains five sub-sections: (1) Data, (2) Text iQ, (3) Stats iQ, (4) Crosstabs iQ, and (5) Weighting. For more information about each of these tabs, please see Chapter 7.
In Stats iQ, you can perform the following analyses:
- T-test (2 Categories vs. Numbers)
- ANOVA (3+ Categories vs. Numbers)
- Games-Howell post hoc tests (3+ Categories vs. Numbers)
- Cohen’s f
- Correlation (Numbers vs. Numbers)
- Pearson correlation
- Spearman correlation
- Point Biserial correlation
- Cohen’s d
- Paired t-test (Numbers vs. Numbers)
- Fisher’s Exact Test (2 Categories vs. 2 Categories)
- Chi-squared (3+ Categories vs. Categories)
- Cramer’s V
- Z-test (Categories vs. Categories)
- Time-series analysis
- Difference in differences (DID, DD)
- Linear regression (OLS, M-estimation, Ridge)
- Logistic/logit regression
This guide provides an overview of options for performing statistical analyses in Qualtrics, but please use caution when interpreting the results. Qualtrics will choose a statistical test, that it deemed appropriate for your data. Before interpreting the results, be sure that you have selected the appropriate statistical test for your data and have checked that your data has met the assumptions for that test. Please see (Section 7.4) or email us for a consultation if you are unsure what test to use.
To begin data analysis, select the Stats iQ tab.
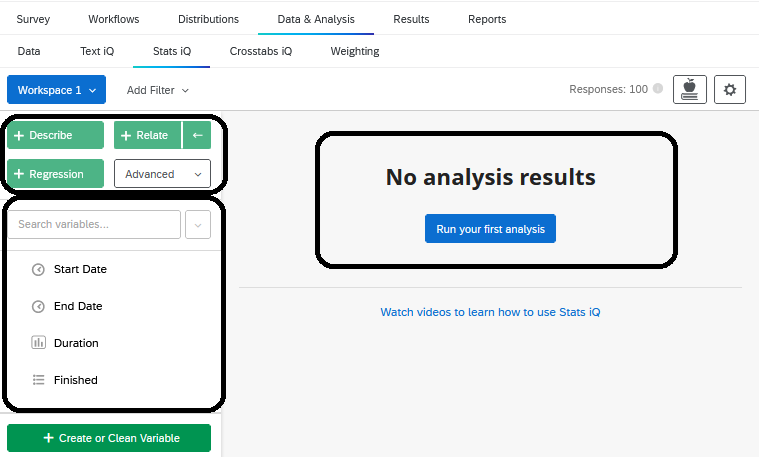
8.2 Stats IQ
Stats iQ is another tool to analyze your data in Qualtrics using statistical analysis. Under the Data Analysis tab, you can access the Stats iQ section.
Within Stats iQ, there are three parts: (1) the variable pane where all the variables are listed, (2) the analysis options, and (3) the workspace where your analyses will appear.
8.2.1 Variable Pane
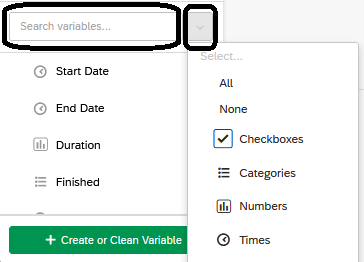
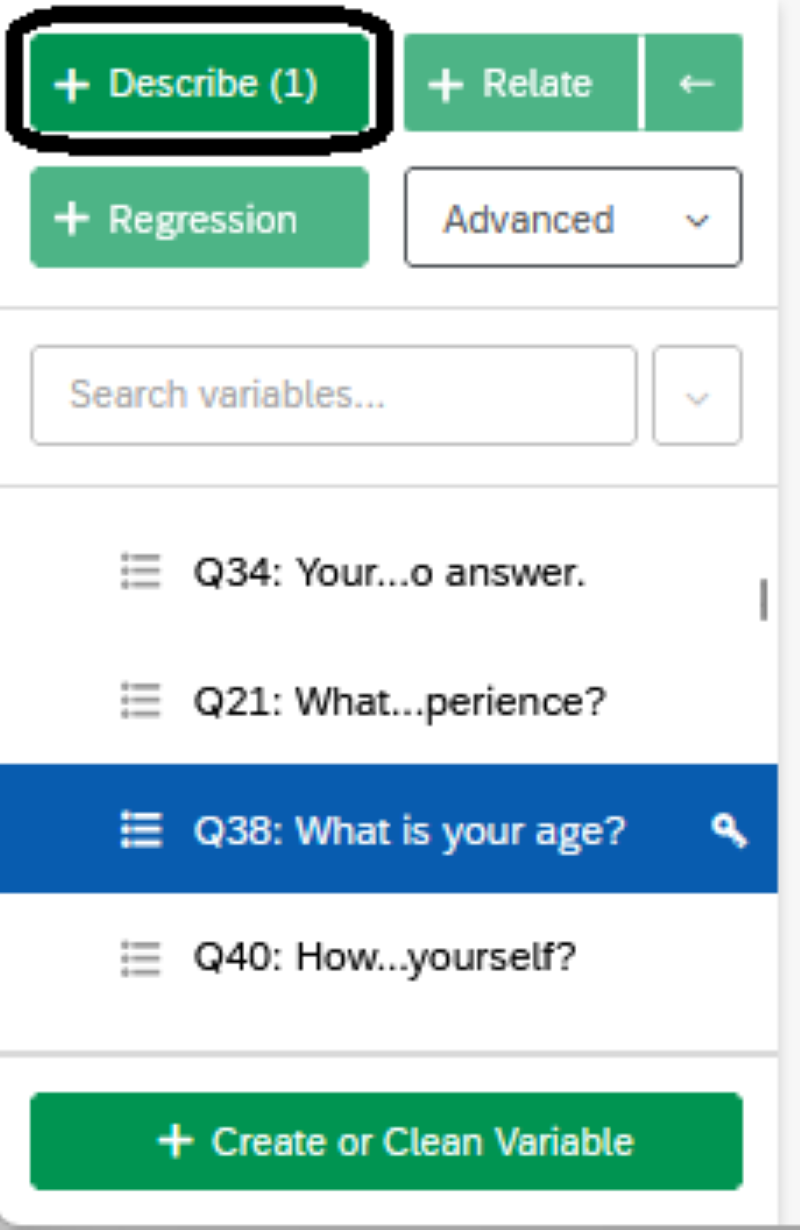
The variable pane includes all the variables (i.e., the questions) from your survey. You may use the search bar to search for a specific variable in your data set. You may also click the drop-down menu to search for specific variable types (e.g., check-boxes, numbers, etc.).
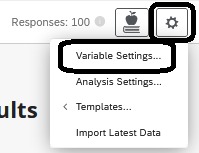
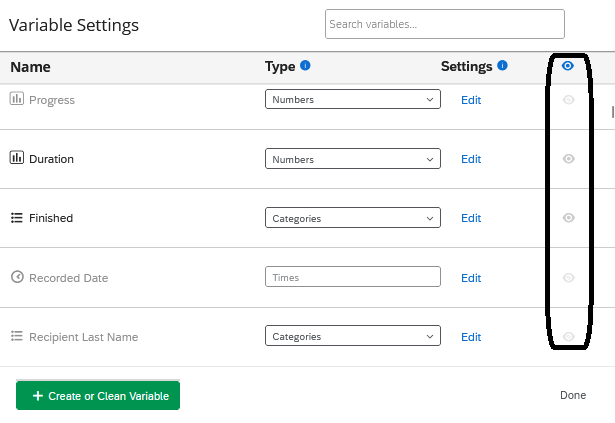
If you are unable to find specific variables, they may be ‘hidden’. Under the ‘variable settings’ you can ‘hide’ or ‘unhide’ variables.
8.2.2 Analyses in Stats IQ
There are several types of analyses that you may choose to run in Stats iQ including: (1) describe, (2) relate, (3) regression, (4) pivot table, or (5) using custom R code. Please note that cluster analysis is not available in this Qualtrics license.
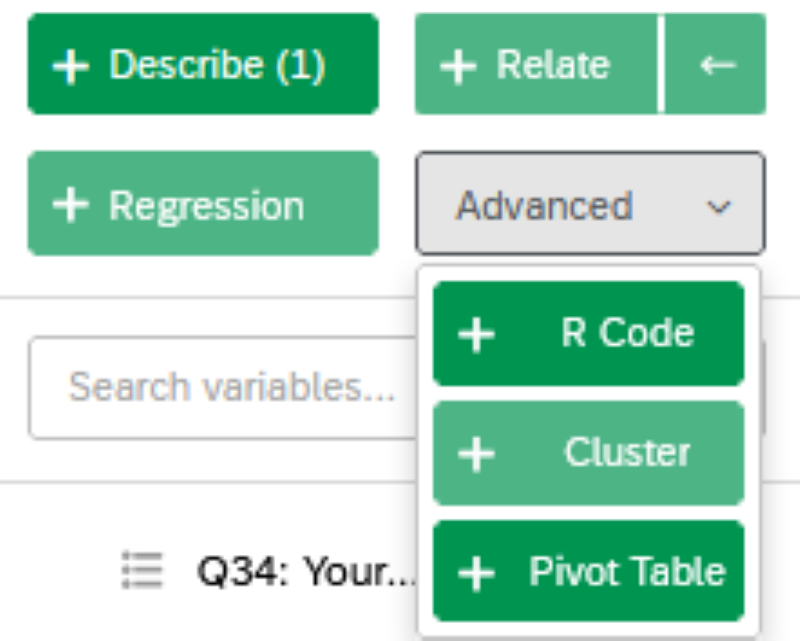
Once you have selected an analysis, it will appear in the workspace, where each result box is called a ‘card’. Please note that you may have up to a maximum of 750 cards in your workspace at a time.
8.2.2.1 Describing Variables
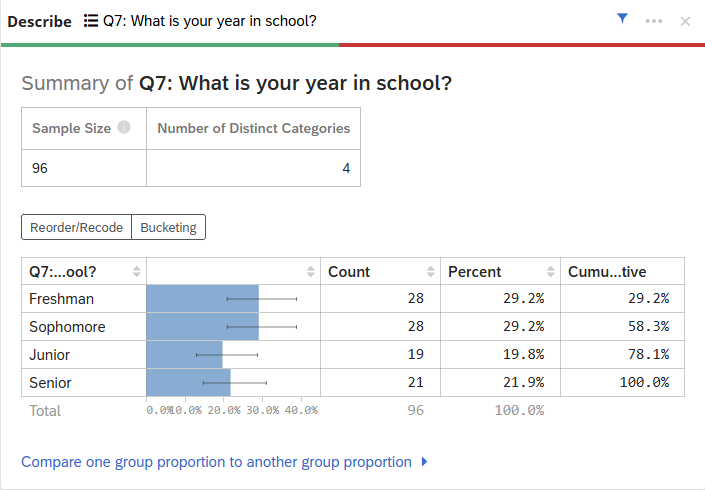
Once you have selected a variable, you may choose ‘Describe’ to summarize its results (e.g., count, percent, or mean, median, etc.). Describing a variable allows you to both summarize and visualize the results of a variable.
If you choose a categorical variable, you will be provided with the count and percentage for each of the categories in the variable.
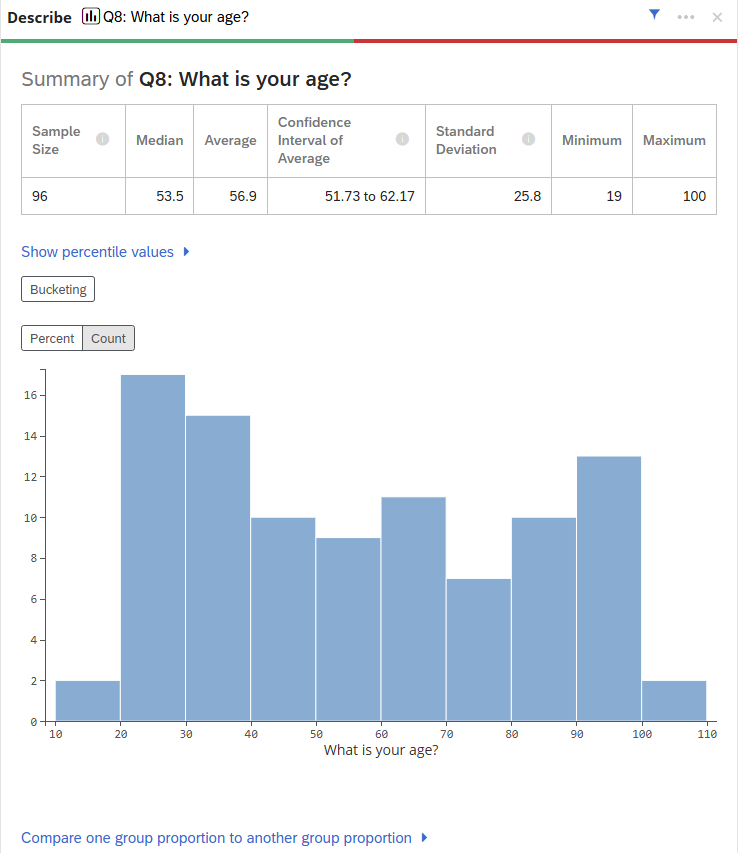
Alternatively, if you choose a numeric variable, you will be provided with a summary consisting of the average, median, minimum, maximum, standard deviation, and the confidence interval of the average. Stats iQ also provides a chart that displays the distribution of your numeric data. You can toggle between count or percent, depending on how you would like to view the distribution.
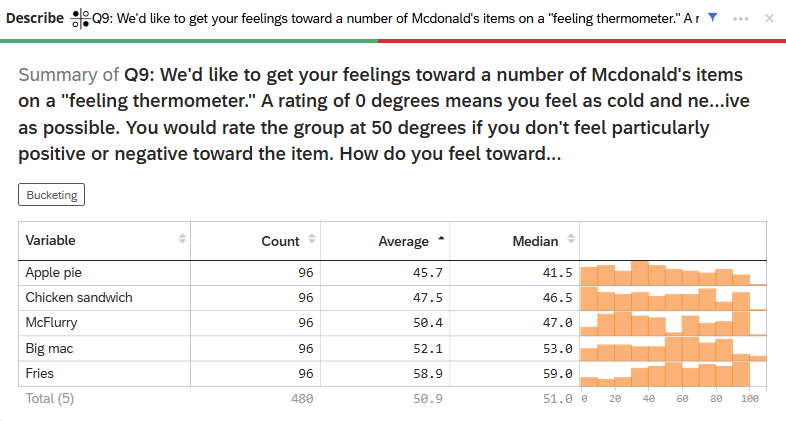
Similarly, if you have a matrix type question with numeric ratings (e.g., feelings toward McDonald’s items), you will be provided with a summary for each item in the matrix question that includes the count, average, median, and the distribution.
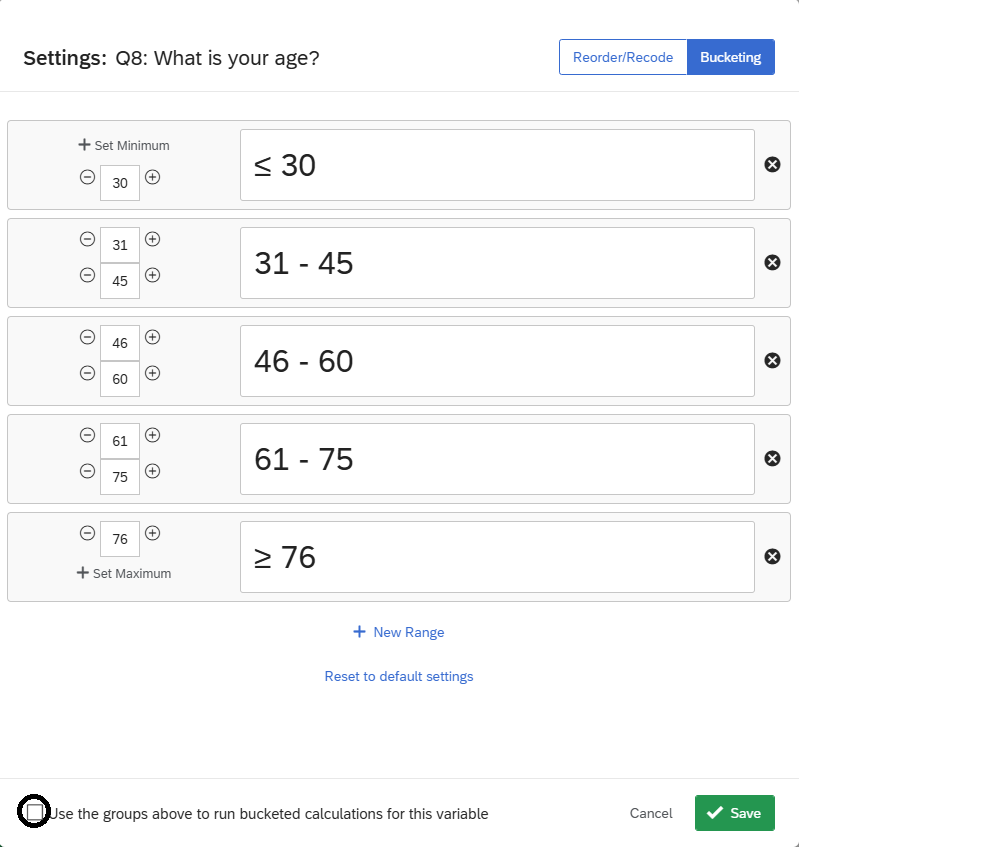
8.2.2.1.1 Bucketing Variables
When you are describing variables, you may choose to “bucket” your variables into new groups or categories.
For example, you can bucket your “age” variable if you are interested in learning about different age categories in your data. Select the “Bucketing” button on the output and bucket your values accordingly (See Figure 10). If you wish to re-run your describe analysis with the bucketed values, check the box “Use the groups above to run bucketed calculations for this variable” and click save.
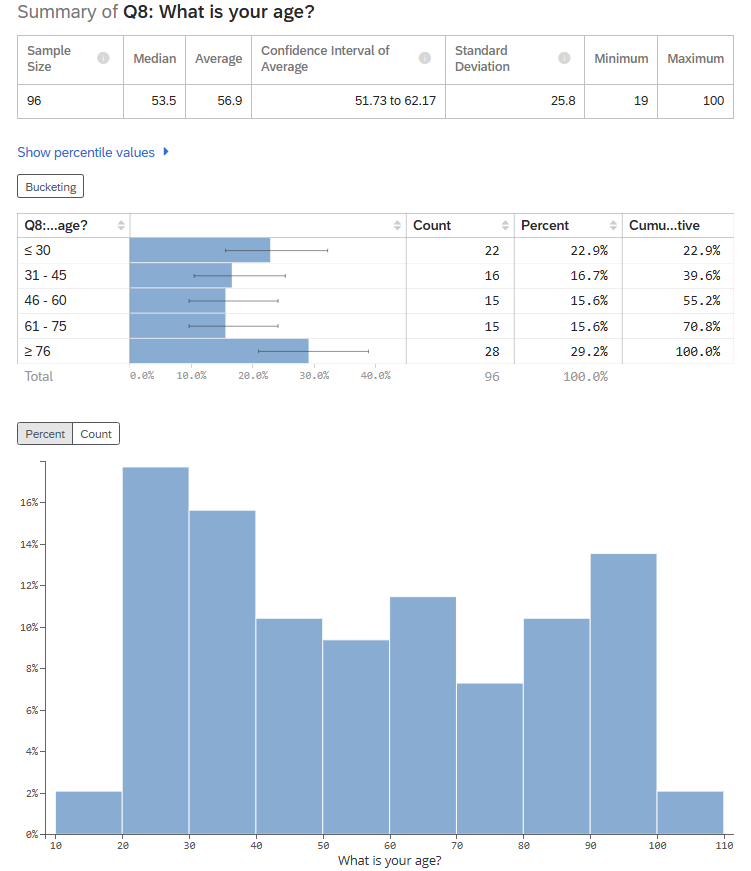
The results should now show both the results after bucketing the variable and without the bucketing.
8.2.2.2 Relating Data
The ‘Relate’ function in Stats iQ allows you to explore the relationship between variables. When you choose two variables to relate, Stats iQ will automatically select the appropriate statistical test depending on the structure of your data and display the results.
The first variable you select will have a ‘key’ displayed next to it, which indicates that it is the independent variable. After you select ‘relate’ the results will display in the workspace, including whether the results are statistically significant. To learn more about the statistical test, select “Show Statistical Test Results” where you can find information about the p-value, effect size, and which test was used. When relating two numeric variables, Stats iQ calculates a p-value and (for effect size) either a Pearson’s r or a Spearman’s rho.
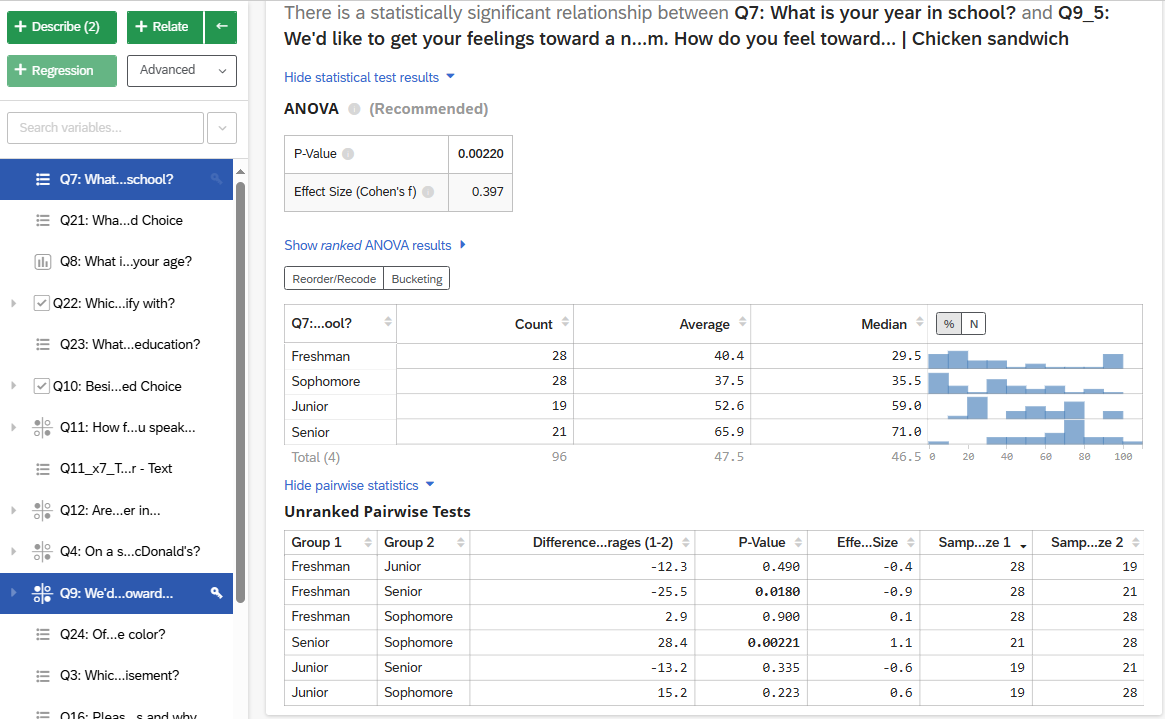
For example, in Figure 12, the results of relating “Year in School” and “Feelings toward McDonald’s chicken sandwich” are shown. An ANOVA was selected as the recommended test, which compares the means of two or more groups by analyzing the variance. In this example, there is a statistically significant result, suggesting there is a relationship between Year in School and Feelings toward McDonald’s Chicken Sandwiches. In the ANOVA, we don’t know which groups are significantly different from one another, so you may select “Show Pairwise Statistics” to explore which groups have significant differences in their feelings toward McDonald’s chicken sandwiches. In this example, Freshmen and Seniors and Seniors and Sophomores have significantly different feelings toward McDonald’s chicken sandwiches.
For more details on how Stats iQ chooses the statistical test, visit the Statistical Test Assumptions and Technical Details page.
8.2.2.3 Regression
The ‘Regression’ analysis in Stats iQ allows you to explore how the value of one variable impacts the value of others. For a regression, the variable with the key is the outcome or dependent variable, while the other variables that you select are the independent variables.
With the regression output, Stats iQ also displays ‘Relative Importance’. The relative importance calculates the proportion of the r-squared contributed by each independent variable (i.e., driver) in the model. It also accounts for situations where the input variables are correlated with one another (i.e., known as multicollinearity).
8.2.2.3.1 Types of Regressions
There are two main types of regression run in Stats iQ. If the output variable is a numeric variable (e.g., a score), Stats iQ will run a linear regression. If the output variable is a categories variable (e.g., binary yes or no responses), Stats iQ will run a logistic regression.
8.2.2.3.2 Running a Regression
After you select your variables, you can select ‘Regression’ to run the analysis. The results displayed include multiple parts.
Please note that Qualtrics will automatically impute missing data for your sample using the mean or median (for continuous data) or by creating a ‘missing’ category for categorical data, by default (e.g., see Figure 13). We recommend turning off this feature.
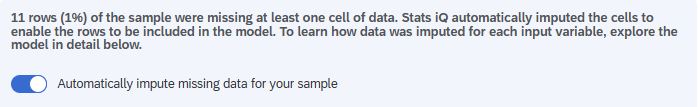
Simple imputation can reduce the variation of your data and increase the degrees of freedom, which means that the significance may be artificially inflated. Under certain circumstances, multiple imputation may be appropriate, but in the case of this, we recommend using a more sophisticated statistical package rather than Qualtrics. You can read more about imputation here.
By default, regressions in Stats iQ use Johnson’s Relative Weights to calculate the relative importance of each variable in the model. First, Stats iQ will display how much the ‘drivers’ or the independent variables (also called explanatory variables) explain the proportion of the outcome variable. In this example, we included three independent variables: Age, Year in School, and Gender. You can select each variable to explore how much the variable accounts for the outcome: Feelings toward McDonald’s Chicken Sandwich. This relative importance is the proportion of the r-squared that is contributed by this variable. The r-squared is the proportion of the outcome variable’s variation that can be explained by the independent variable in the model.
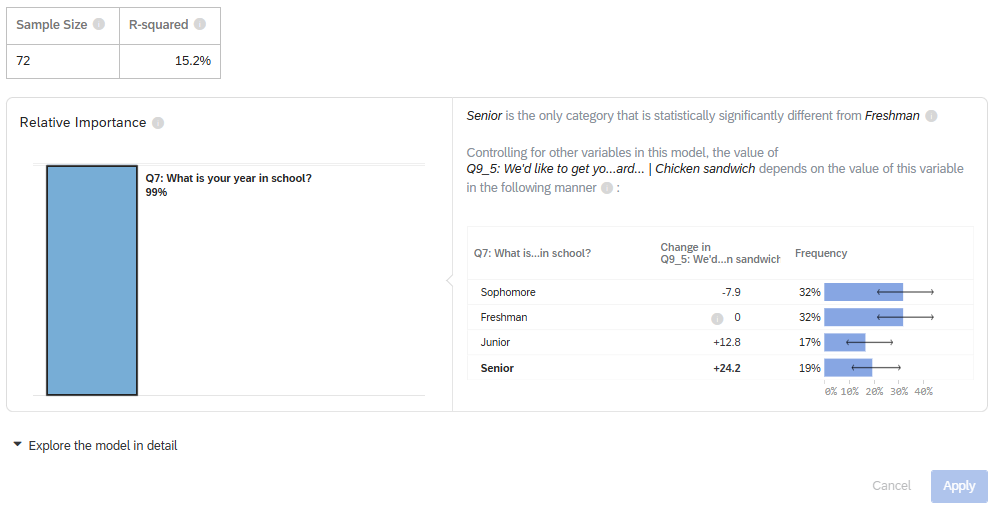
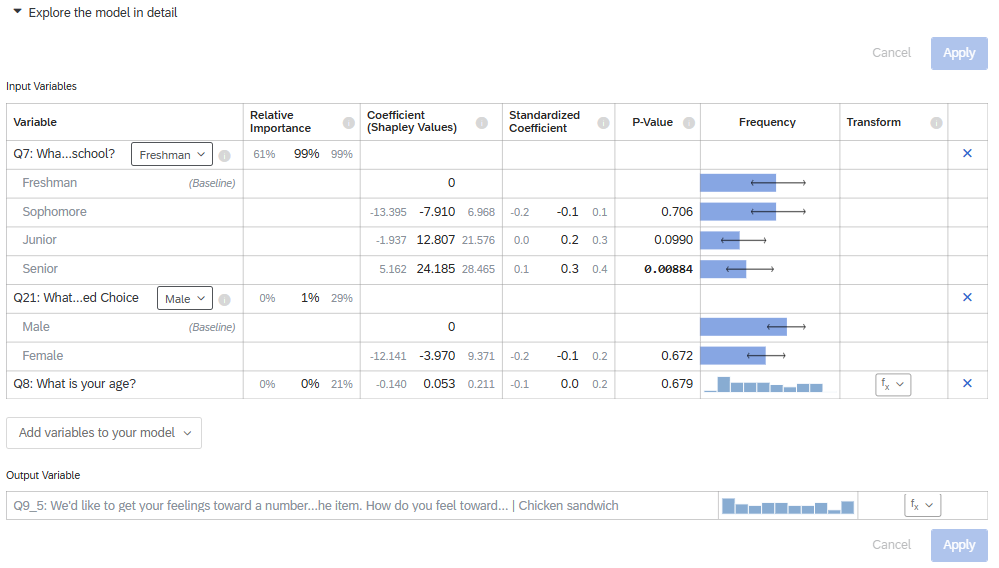
In the second part of the results, you can explore the model in detail. This provides the relative importance along with the coefficients (included standardized coefficients and confidence intervals), p-values (significant results are bolded), and frequencies. In this table, you can “toggle” to select which values you would like as the baseline. The coefficients from all the other categories are statistically tested against the baseline category’s coefficient.
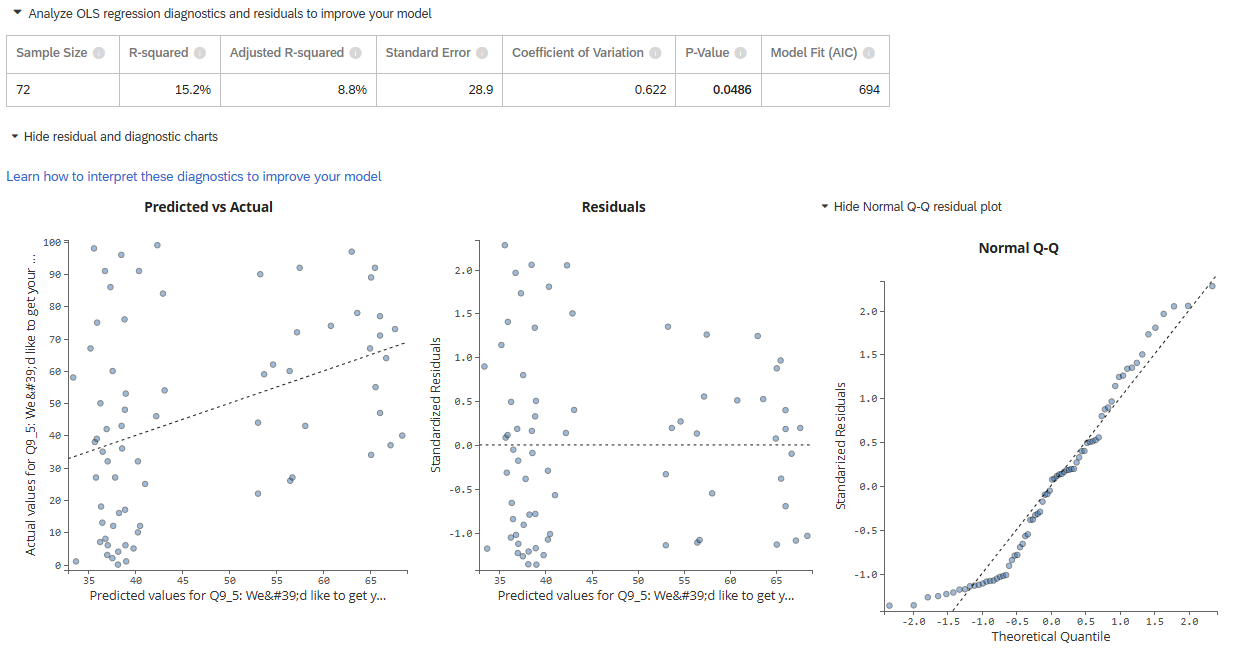
In the third part of the results, you can analyze the OLS regression diagnostics and residuals to improve your model. This includes the R-squared values, standard error, model fit (AIC), p-value, and the coefficient of variation. Plots are also included that visualize the predicted vs. actual values, residuals, predicted accuracy distribution, and a normal Q-Q residual plot.
8.2.2.3.3 Regression Methods
By default, regressions in Stats iQ use Johnson’s Relative Weights to calculate the relative importance of each variable in the model. One advantage of this method is that it provides results that are easy to interpret: In the output, you can easily see which “drivers” or independent variables have the largest effect on the dependent variable. A second advantage is that the relative weights approach accounts for potential multicollinearity between the independent variables, meaning that even if you enter two variables that are highly correlated with each other (such as your mother’s education level and your father’s education level), the results can be trusted.
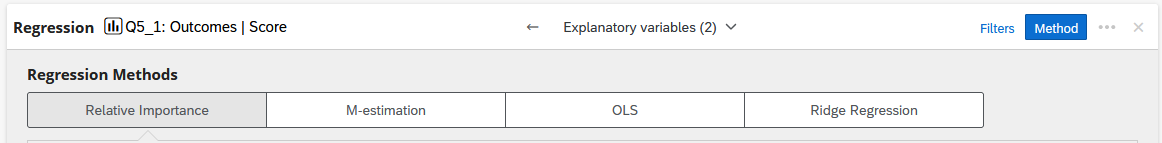
Many researchers may be more familiar OLS (“ordinary least squares”) regression than with relative weights. After running a regression in Qualtrics, you can choose between relative weights, M-estimation, OLS, or Ridge regression.
To change between regression methods, click Method in the top-right of the regression card.

Then choose the appropriate method from the list.
For those who need to cite Johnson’s Relative Weights or who would like more details about the underlying statistical procedure, we recommend the articles by Johnson & LeBreton (2004) or Tonidandel & LeBreton (2011).
In a nutshell, the relative weights procedure is conducted by (1) deriving an orthogonal set of predictors from the original predictors, (2) regressing the outcome variable on the orthogonal set, (3) regressing the predictors on the orthogonal set, and finally (4) calculating the “relative weight” of each predictor by summing the products of the relevant coefficients across the two models.
Outside of Qualtrics, relative weights can be computed in statistical packages using the steps described in this blog post or by using Tonidandel’s web app or the rwa R package.
For more on Stats iQ: - Stats iQ Overview - Stats iQ Variable Settings - Stats iQ Analysis Settings - Stats iQ Statistical Tests - Stats iQ Statistical Test Assumptions - Analyzing Text iQ in Stats iQ