11 Using Weighting
This guide is a work in progress, and will be updated substantially as time allows. If you find an error, please let us know.
11.1 What is Weighting?
Weighting is a technique that adjusts responses from a survey to be more representative of a target population. This technique is helpful because survey responses often do not accurately represent a target population due to sampling biases and varying response rates. In other words, the way a certain characteristic (such as age, education, race, sex, etc.) of your sample is distributed may differ from the way it is distributed in the population. For example, your sample may consist of 60 percent women, when women make up only 52 percent of the population. This introduces bias into any estimate you may obtain from your sample data because statistical procedures will give greater weight to those people who are overrepresented.
There are two common types of survey weights:
- Design weights: used to compensate for over- or under-sampling specific cases or for disproportionate stratification (e.g. by deliberately oversampling a small subgroup of the population).
- Post-stratification weights: A post-stratification survey weight is a value assigned to a given answer that accounts for the proportion of the population that they represent. It is called a post-stratification weight because you can only compute it after you have collected all your data. The stratification part comes from the fact that you use various known strata (such as age group or sex distribution) of the population to adjust your sample data to conform more to the population’s parameters.
In order to calculate a post-stratification weight, you need an auxiliary data set to which you can compare your sample data. For example, if you were conducting a survey of residents of Illinois, you would need census data or Current Population Survey data that show the demographic characteristics of the population of Illinois. You could then compare your sample to the auxiliary data file, to make sure that the distribution of demographic characteristics (such as age, education, race, sex, etc.) is similar to that of the auxiliary data. If the distributions are close enough, there is no need to calculate post-stratification weights. However, if they differ by more than a few percentage points, you will want to calculate the weights. Post-stratification weights are usually computed as follows:
\[ \frac{Population Proportion}{Sample Proportion} = Weight \]
11.2 Data & Analysis
From your survey, you can navigate to the Data & Analysis tab to view your data. Using a campus-wide account, this tab contains five sub-sections: (1) Data, (2) Text iQ, (3) Stats iQ, (4) Crosstabs iQ, and (5) Weighting. For more information about each of these tabs, please see Chapter 7.

Under Weighting, you can create three types of weighting schemes:
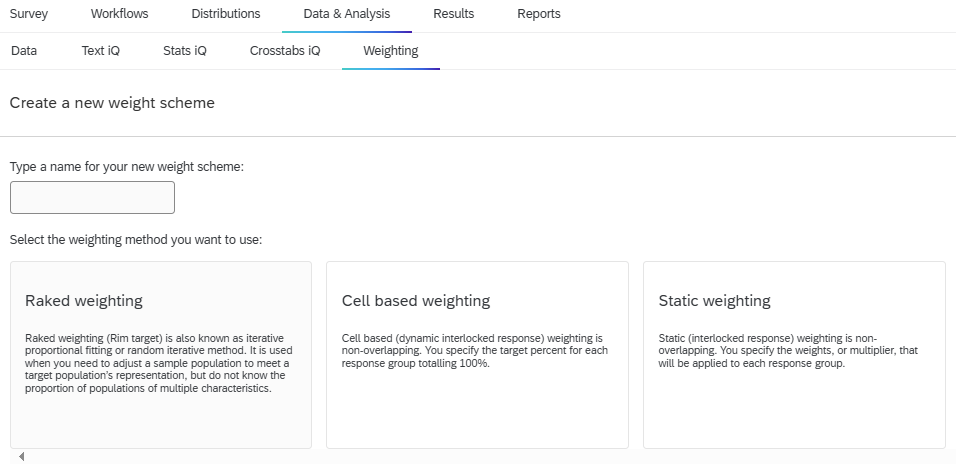
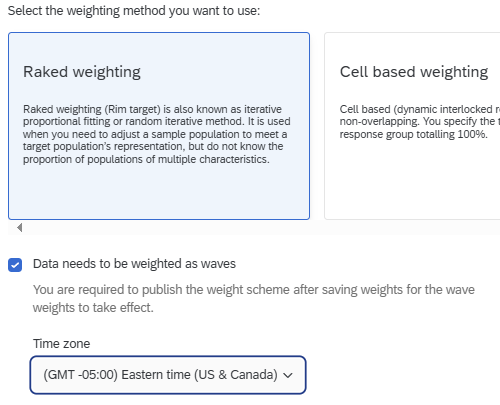
- Raked weighting: Raked weighting (Rim target) is also known as iterative proportional fitting or random iterative method. It is used when you need to adjust a sample population to meet a target population’s representation, but do not know the proportion of populations of multiple characteristics.
- Cell based weighting: Cell based (dynamic interlocked response) weighting is non-overlapping. You specify the target percent for each response group totaling 100%.
- Static Weighting: Static (interlocked response) weighting is non-overlapping. You specify the weights, or multiplier, that will be applied to each response group.
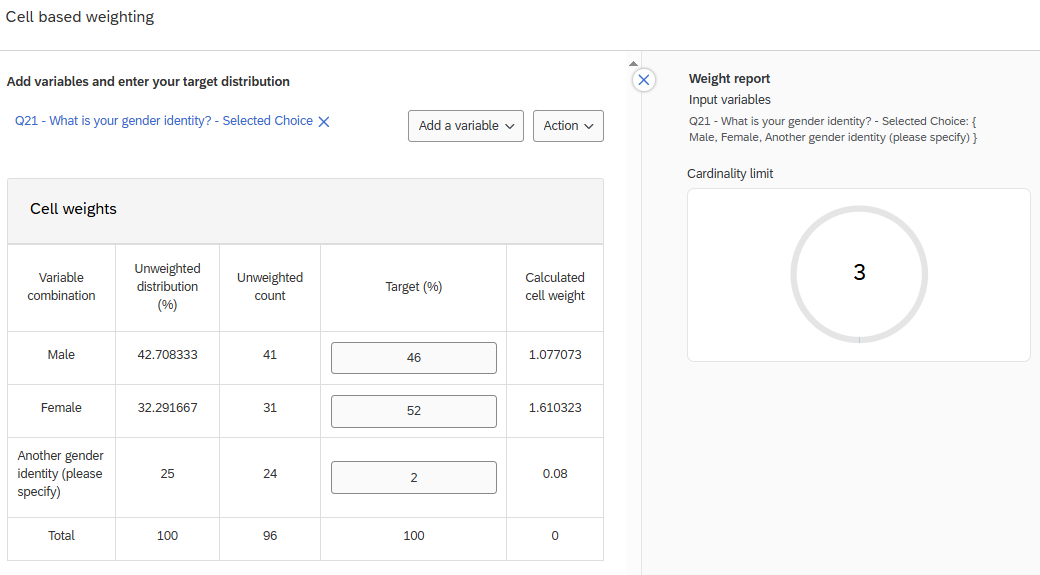
In Qualtrics, you specify the target % and the weight will be computed for you.
Take cell based weighting for example (see Figure 3). First, select the variable you are interested in weighting (e.g., gender). In this example, I set the target % for Males as 46%, 62% for Females, and 2% for another gender identity. Qualtrics will then generate the cell weight based on these target percentages.
As you add weights, Qualtrics will generate a weight report that includes the variables being used in the weighting scheme, sample balance, weight efficiency, quality, and the cardinality limit. The cardinality limit is calculated by the multiplying the number of categories for each of the variables together (Note: the max is 5,000).
For each of these weighting schemes, you may also apply wave based weighting, which allows you to apply unique weights over different time periods or categories.
For more on Weighting: - Weighting Overview