4 Ensuring Accessibility
In general, any digital content that the university creates, publishes, or shares broadly must be accessible. For details, please see this FAQ from the Office of the Provost or this article from the Office of the CIO.
This section includes tips for building accessible surveys, divided into sections on accessibility features that can be enabled in Qualtrics and accessibility standards to account for when designing your survey. For more information, you can also consult Qualtrics accessibility documentation.
4.1 Enabling Accessibility Features
Unfortunately, Qualtrics does not enable all of its accessibility features by default. The first step to ensure your survey can be perceived and operated by your survey takers is to switch to the New Survey Taking Experience, when possible. Keep reading for details on enabling this feature and alternatives for specific use-cases.
4.1.1 Enabling the New Survey Taking Experience
The New Survey Taking Experience is enabled by default for all surveys created since January 2026.
You can enable the New Survey Experience for an older survey as follows:
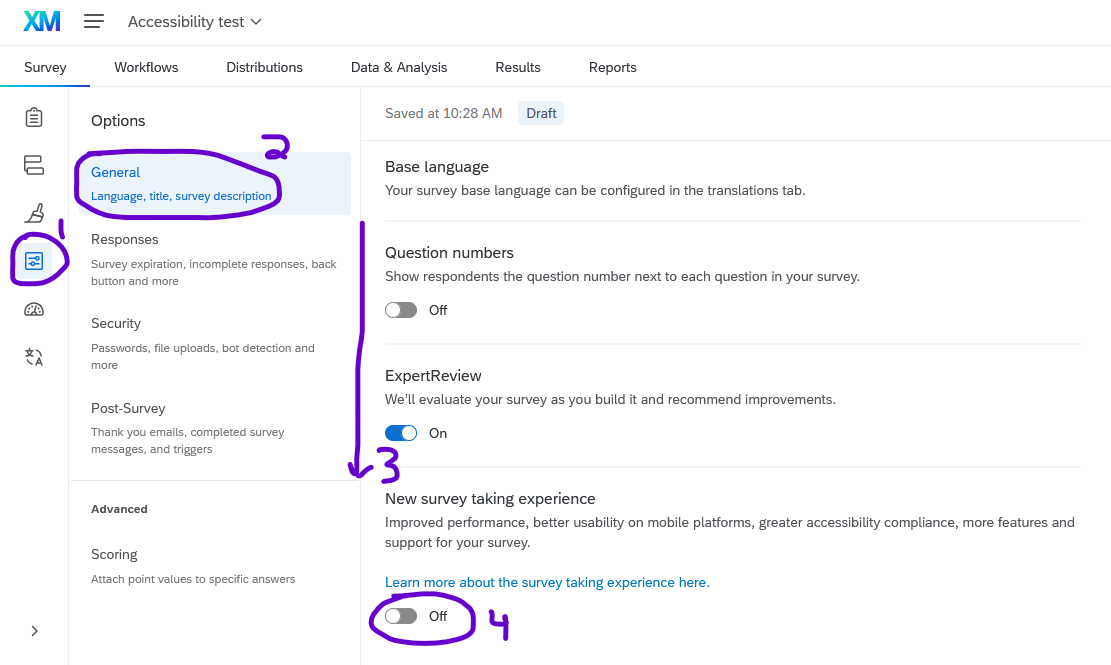
Under Survey options, in the General tab, scroll down to the bottom of the list, and toggle the slider titled New survey taking experience.
4.1.2 Details about the New Survey Taking Experience
For a full overview, please see the Qualtrics documentation on the New Survey Taking Experience
The New Survey Taking Experience includes improvements for survey takers, including:
- Visual signals emphasizing where the survey taker is typing and which responses have been chosen.
- Better support for screen readers and keyboard users, especially with matrix questions.
- Clearer indication of questions that force a response see Section 2.4.1) with an asterisk. (The asterisk is read as “required” by screen readers.)
- Better display on mobile devices.
However, the New Survey Taking Experience does not yet include all features. Specifically,
- A few question types such as Hot Spot and Heat Map are not yet supported.
- If you are using custom Javascript, the
jQuerylibrary must be loaded manually. - When the new experience is applied, you will not be able to change your survey layout in the Look and Feel menu (see Section 15.1.2).
See the Qualtrics documentation on unsupported features for a full list or instructions for how to disable the New Survey Taking Experience.
4.1.3 Alternatives to the New Survey Taking Experience
If you choose not or are unable to use the New Survey Taking Experience, you are responsible to make the following accessibility considerations, depending on the types of questions in your survey and your survey audience.
4.1.3.1 Matrix Questions
Most matrix questions are not initially accessible to users with screen readers. However, they can easily be modified to be made accessible.
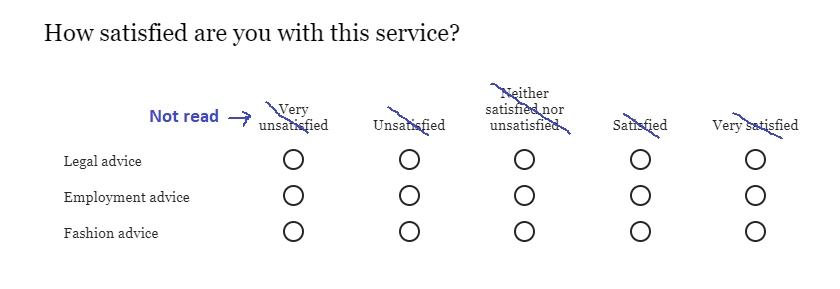
By default, matrix questions are not accessible unless the survey uses the New Survey Taking Experience. Because of how Qualtrics implemented the HTML coding, screen readers cannot read the column headings, so users will not know what the scale points are.
You can make matrix questions accessible by implementing any of the following solutions:
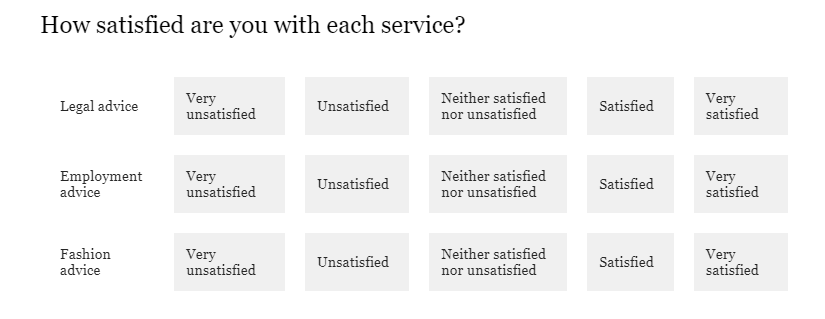
Change the Format to Profile
- After choosing the Matrix type as Likert, type the scale points across the top (i.e. “Very unsatisfied” through “Very satisfied”.)
- In the Question editing pane on the left, scroll down to Format and change from Standard Likert to Profile.
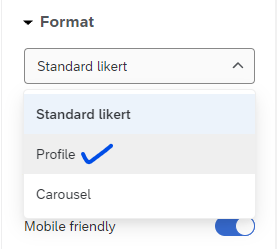
- Once the question is in “Profile” format, you can optionally change the text for any of the items.
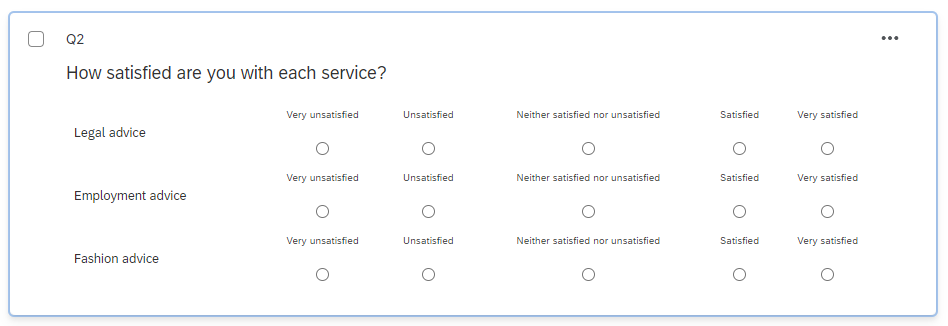
- When respondents see the question, they will see labels on each item, and screen readers will read the content correctly.
Add a bit of JavaScript to your survey heading
- In the Look and feel tab, select General and scroll down to see Header.
- In the Header field, click edit and in the editor, click the Source button to edit the source code.
- Paste the following code, then click Save.
<!-- make matrix questions accessible! -->
<!-- Load jQuery if it's not loaded -->
<script src="https://code.jquery.com/jquery-3.7.1.min.js"
        integrity="sha256-/JqT3SQfawRcv/BIHPThkBvs0OEvtFFmqPF/lYI/Cxo="
        crossorigin="anonymous"></script>
<!-- Fallback to load jQuery if jquery.com is down -->
<script>
    if (typeof jQuery === 'undefined') {
        document.write('<script src="https://cdnjs.cloudflare.com/ajax/libs/jquery/3.7.1/jquery.min.js"><\/script>');
    }
</script>

<!-- Change 'aria-hidden' to 'false' to make the headers accessible -->
<script>
    (function() {
        if (typeof jQuery !== 'undefined') {
            $(document).ready(function() {
                $('.Answers').each(function() {
                    $(this).attr('aria-hidden', 'false');
                });
            });
        } else {
            console.error('jQuery is not loaded. Please check your CDN.');
        }
    })();
</script>Matrix questions must also be “Mobile friendly” to be accessible (which is in the question editing pane); this option is enabled by default.
Whenever you change between question formats, double-check that none of the question text or answer choices have changed. Make corrections as needed.
Some less-common types of matrix questions, including rank order, constant sum, and text entry, are accessible by default.
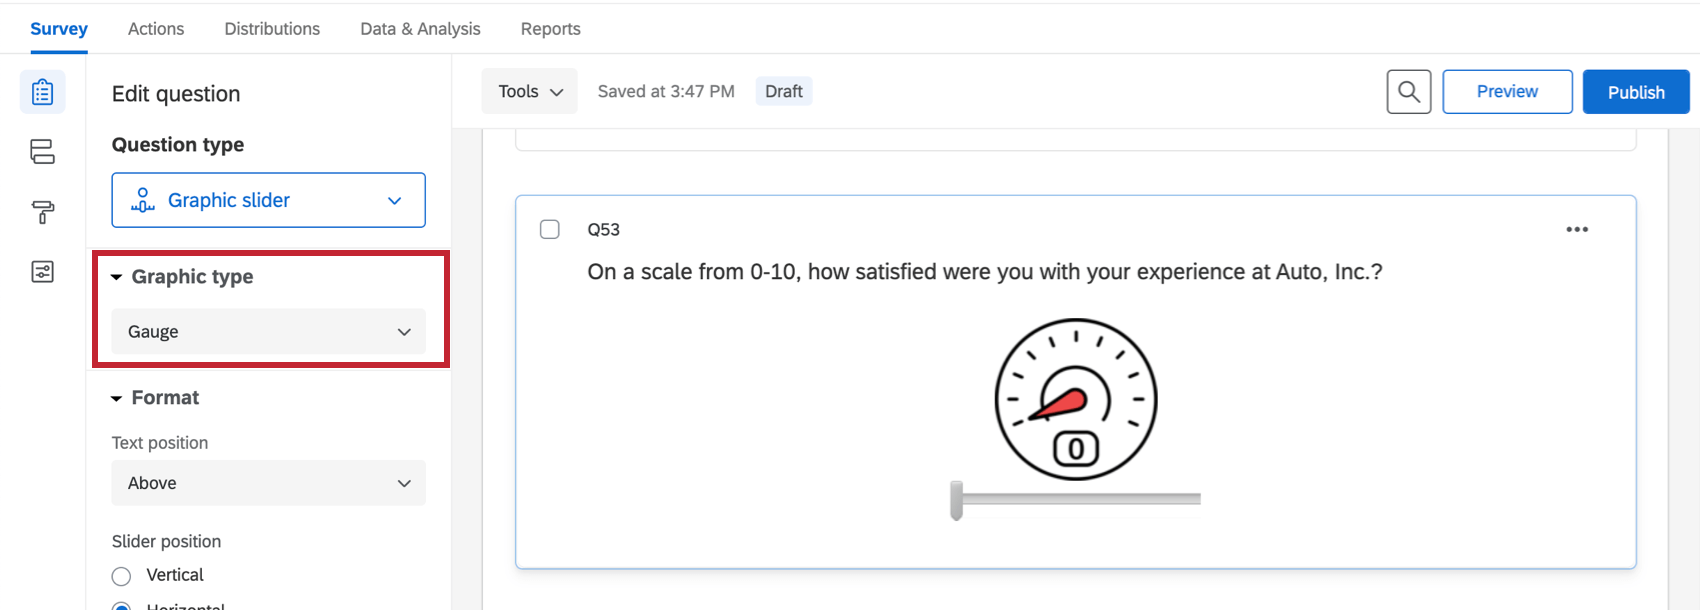
4.1.3.2 Graphic Slider Questions
Graphic Slider questions have been disabled by default for everyone at the university because they are not accessible to blind users. They can be re-enabled on a case-by-case basis, especially for researchers working with sighted but non-literate participants. They are not compatible with the New Survey Taking Experience.
Graphic Slider questions include a slider bar next to a picture, and as the respondent slides the slider, the image changes. (The image has no alt text.)
If a survey contains graphic sliders, unless you have permissions individually enabled by a brand or division administrator, you will not be able to copy that survey. To copy the survey, delete the graphic slider question, change it to a different question type, or contact CITL Data Analytics and we will be happy to help.
4.2 Other Accessibility Features
While the New Survey Taking Experience (or workarounds described above) is an important first step, there are also other options you can enable to increase the accessibility of your survey.
4.3 Accessibiliy Standards
In addition to enabling certain Qualtrics features, creating an accessible survey requires paying some attention to the text and other content of your survey so that all survey takers can perceive, operate, and understand it. The suggestions in this section are consistent with best practices, but at the end of the day, you are responsible for your own survey content. Moreover, in some cases, such as surveying children, researching response times, or studying color perception, some of the standards below may not apply. If you have questions, consult an accessibility specialist on campus.
4.3.1 Text Size and Contrast
By default, text in surveys has sufficient size and contrast to be visible to survey takers with low vision. If you change the text color, ensure that it has sufficient contrast by using a contrast checker. If you change the font size, make sure it is large enough to be easily readable.
4.3.2 Timing and Autoplay
Whenever possible, avoid using auto-advance or other time limits, as they present issues for survey takers with motor or cognitive disabilities. If you include audio or video content, make sure that survey takers can pause, rewind, and fast-forward the content. (For details, see this WebAIM article on time limits.)
4.3.3 Alternative Text for Images
If you add images to a survey, it is your responsibility to add alternative text (“alt text”) so that users who cannot see the image can still understand the information that the image conveys.
The Illinois wordmark included at the top of surveys by default includes alt text.
If you add a custom header image, please use HTML to center it or contact CITL Data Analytics for help.
4.3.3.1 Adding an Image in the Text of a Question
To add an image with alt text to question text, first create a text question and open the rich content editor.
Avoid using the Graphic question type because it does not (currently) allow alt text to be added. 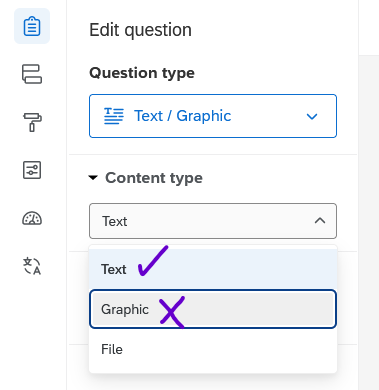
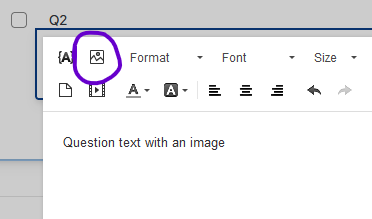
In the rich content editor, add text if you would like, then click the Insert Graphic icon on the top row.
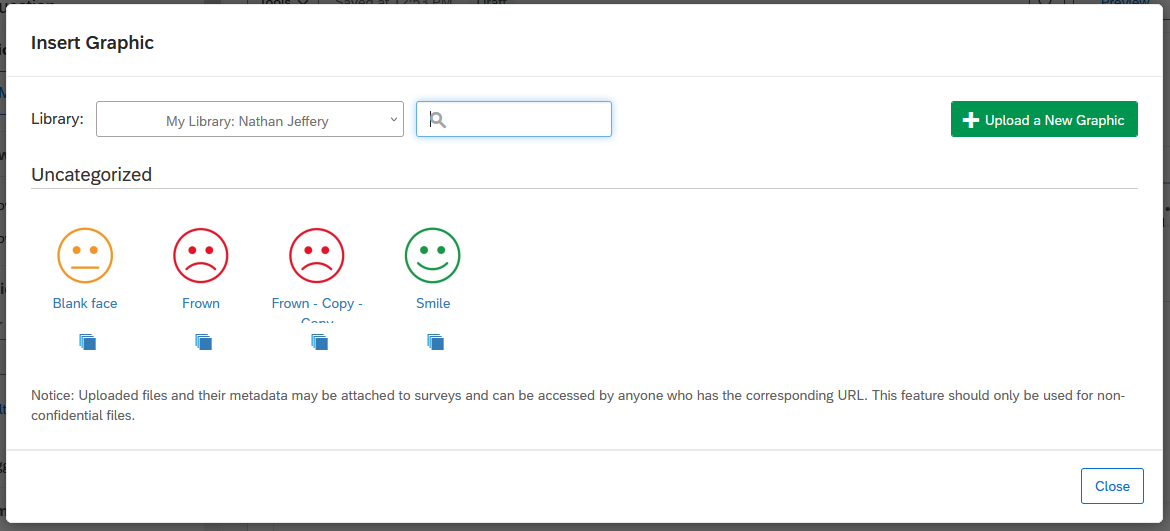
In the popup window, upload an image or choose one from your Qualtrics library.
The image will appear inline with any question text, and you can click and drag to change its size or position.
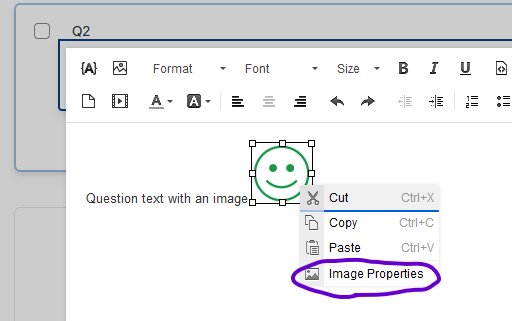
Next, right-click the image and choose Image Properties.
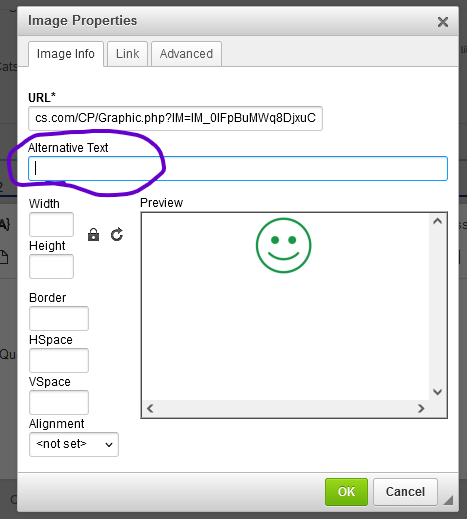
In the Image Properties popup window, type the alt text in the Alternative Text field, then click OK.
For graphs, charts, and other technical images that convey detailed information, alt text may not be sufficient to covey the content of the image, especially since alt text should be succinct. In such cases, provide the information from the image in another way, such as by linking to a description hosted externally (such as cPanel or WordPress) providing a file download, or linking to a file or folder hosted on Box.
Avoid using the Long Description field in the Image Properties window because it has been deprecated.
In general, text is more accessible than images because it can be zoomed in, read by screen readers, and set to high contrast by the viewer. If you have formatted text (colors, fonts, etc.), consider recreating the formatting in the rich content editor (using HTML markup if necessary) rather than taking a screenshot of the text.
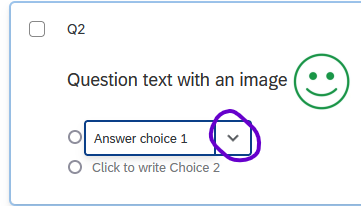
4.3.3.2 Adding an Image in the Response Choices
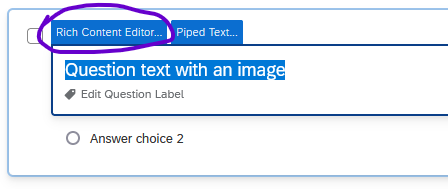
To add an image with alt text to a response choice, click the response choice, then click the dropdown arrow that appears to open the menu.
In the dropdown menu, choose Rich Content Editor.
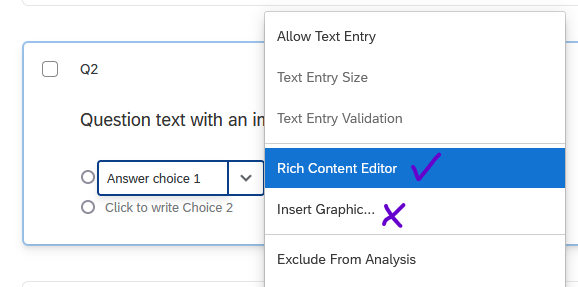
Avoid using the Insert Graphic option because it does not (currently) allow alt text to be added.
In the rich content editor, insert the image using the steps described above. From this point, the process is the same as inserting an image in question text.
4.3.3.3 Alt Text Resources
For information about writing good alt text, see these resources: