10 Using Crosstabs iQ
A cross tabulation (crosstab) is a data table that compares the relationship between two or more categorical variables (e.g., gender and favorite fruit). A crosstab can be used to generate the frequency or proportion of respondents that fall into a particular row/column.
Qualtrics provides the Crosstab iQ tab that allows you to perform multivariate analysis on two or more variables, including chi-square and analysis of variance (ANOVA) tests.
To navigate to the Crosstab iQ tab, select the Data & Analysis tab and then Crosstabs iQ. 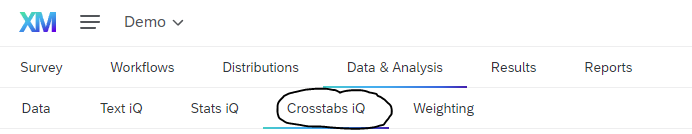
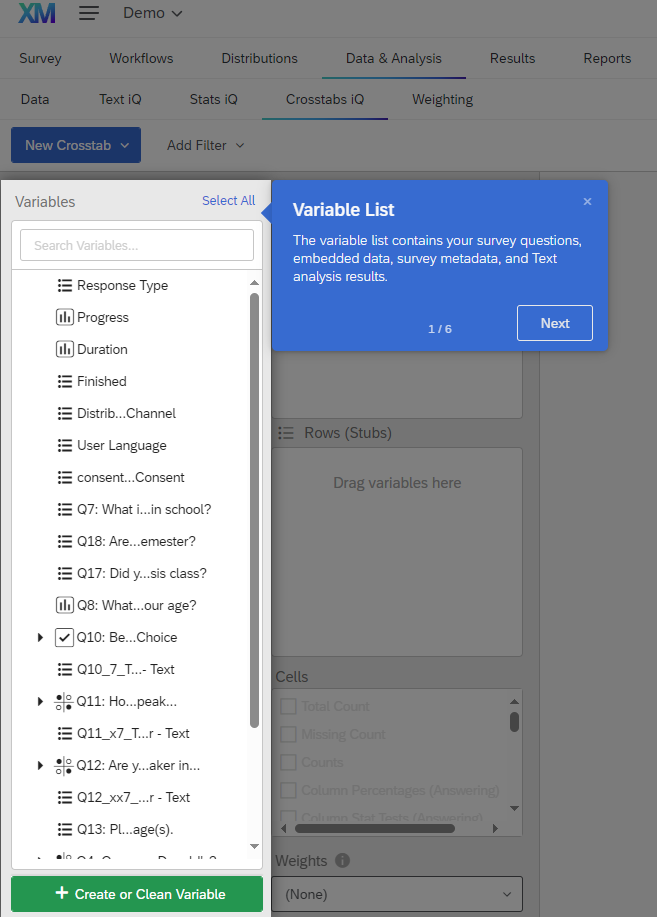
In the Crosstabs iQ tab, there is the Configuration Sidebar on the left including the Variable List, Columns/Banners, Rows/Stubs, Cells and the Output pane on the right. The Variable List includes survey questions, embedded data, metadata, and text analysis results.
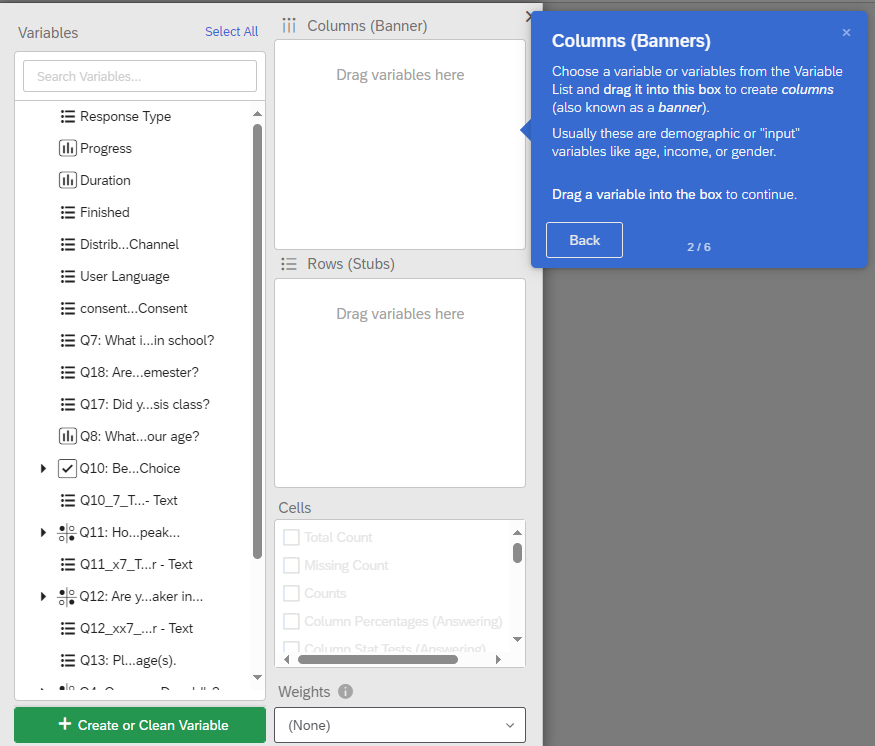
In the variable pane for Columns (also called banners), you may drag and drop variables from the Variable List. Variables inserted into the column pane are typically independent or input variables.
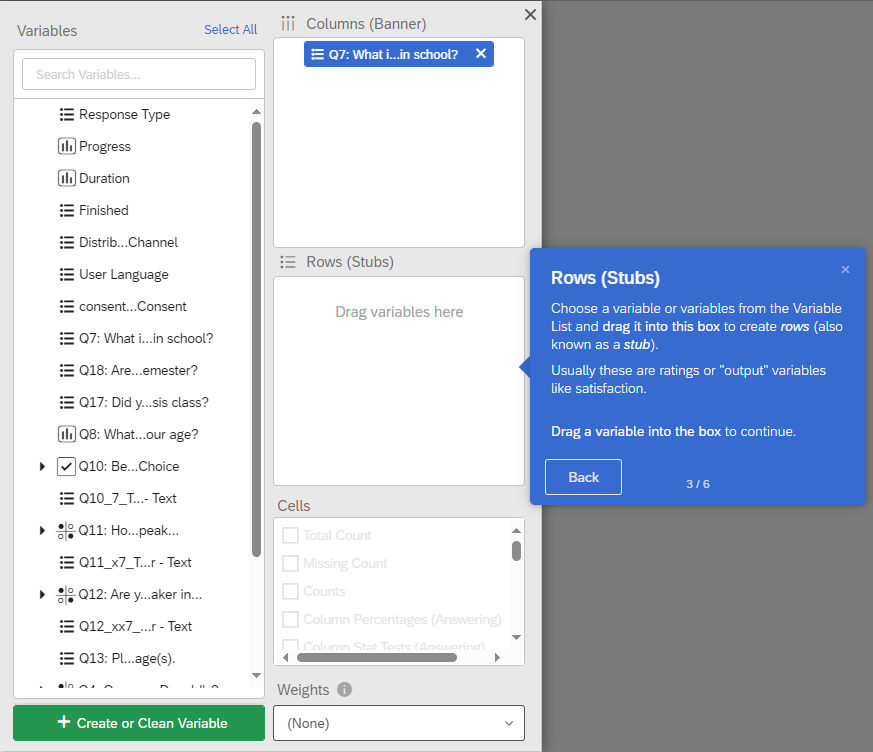
In the variable pane for Rows (also called stubs), you may drag and drop variables from the Variable List. Variables inserted into the row pane are typically dependent or output variables.
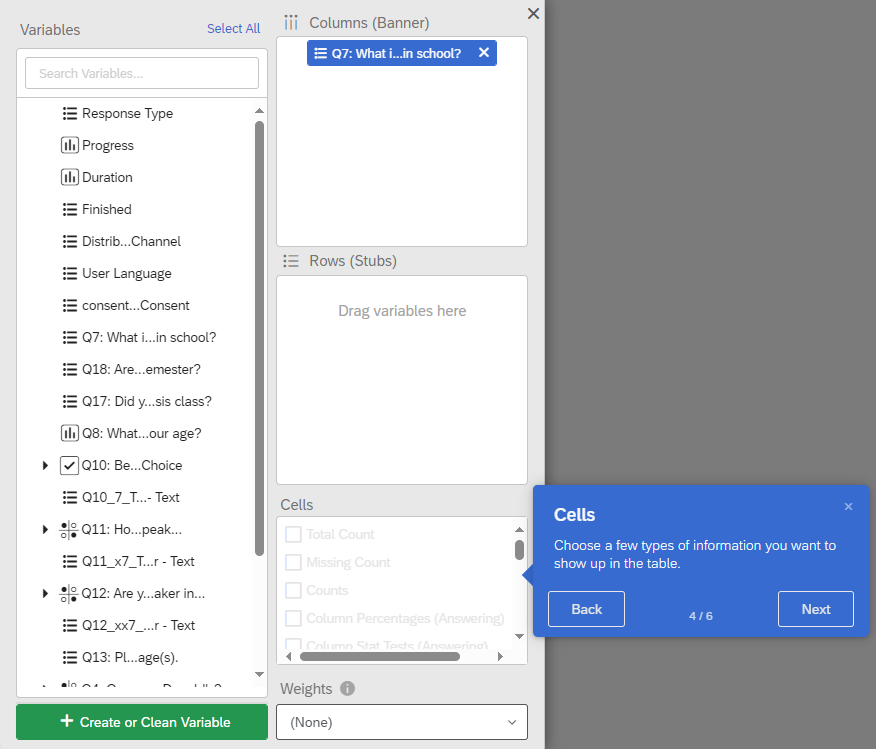
In the variable pane for Cells, you may select the type of information or analysis you would like to see (e.g. counts/frequencies, column percentages, etc.)
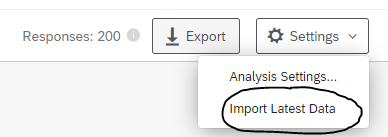
If you are actively collecting data or have added new data, be sure to import your latest data into your workspace under Settings.
In Crosstabs iQ: - Variables are automatically listed in survey order - Response items within variables are listed in survey order by default - Response items within variables are displayed with any extra HTML removed - Survey recodes are automatically imported into Crosstabs - For multi-selects behind skip or display logic, ability to show “Column Percentages (Answering)” - Banners can be bucketed (merged) in the same fashion as stubs - Many variables can be dragged to a different box at the same time - Checkbox stubs column percentages are calculated as a percentage of all survey takers, not a percentage of the total number of checkboxes selected - Changes made to one variable can be applied to all other variables - “Topline” crosstabs can be made with a stub and no columns
10.1 Descriptive Analysis
In Crosstabs iQ, you can perform descriptive analysis (e.g., summarizing your data) by creating a frequency distribution or by calculating descriptive statistics such as the mean, median, and mode (for numeric variables).
10.1.1 Numeric variables
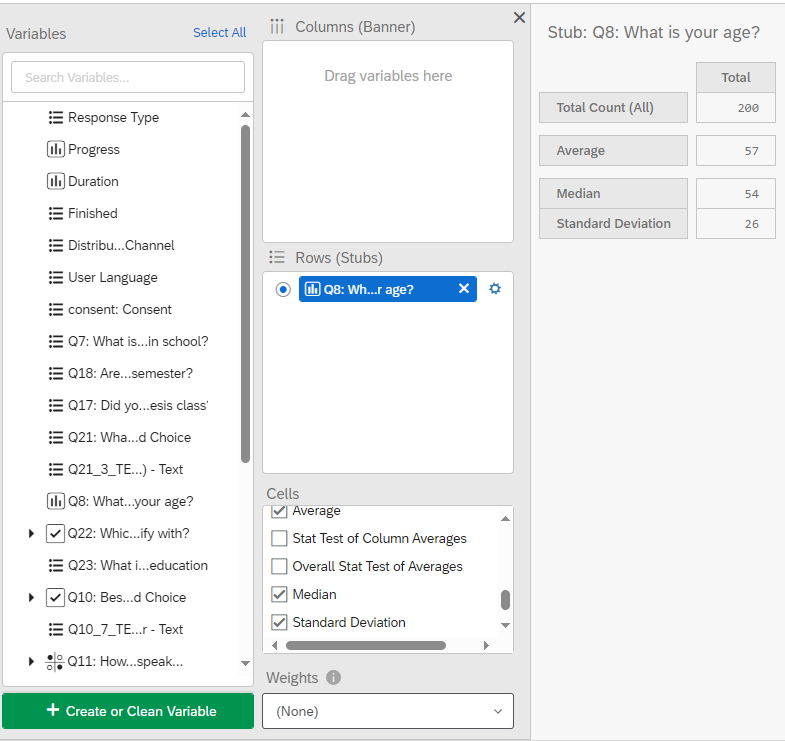
To calculate descriptive statistics for a numeric variable, you can drag and drop a variable into the Rows (Stubs) pane. In the Cells pane, you can select which descriptive statistics you would like to calculate (e.g., count, median, average, etc.)
10.1.2 Bucketing Numeric Variables
If you have a numeric variable whose values you would like to recode into new groups, you can choose to bucket the variable. For example, if you have a numeric variable for Age, but instead you would like to analyse age groups, you can bucket the values into different age groups.
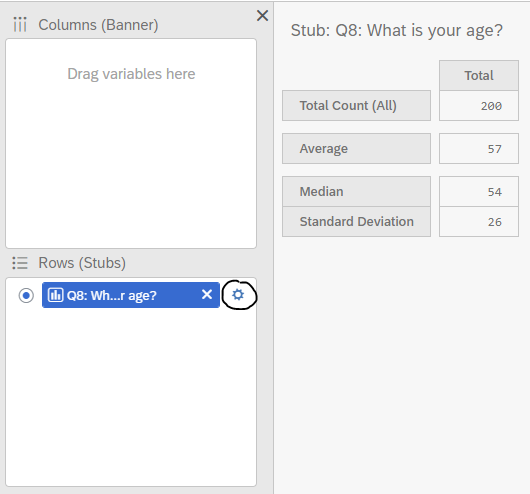
To do so, first select the Variable Settings (gear icon).
Next, select Bucketing and set the buckets for the variable. I have also selected the checkbox If this variable is included in a banner (columns), also show unbucketed version. By default, the bucketed version is shown in the banner. Then, click save.
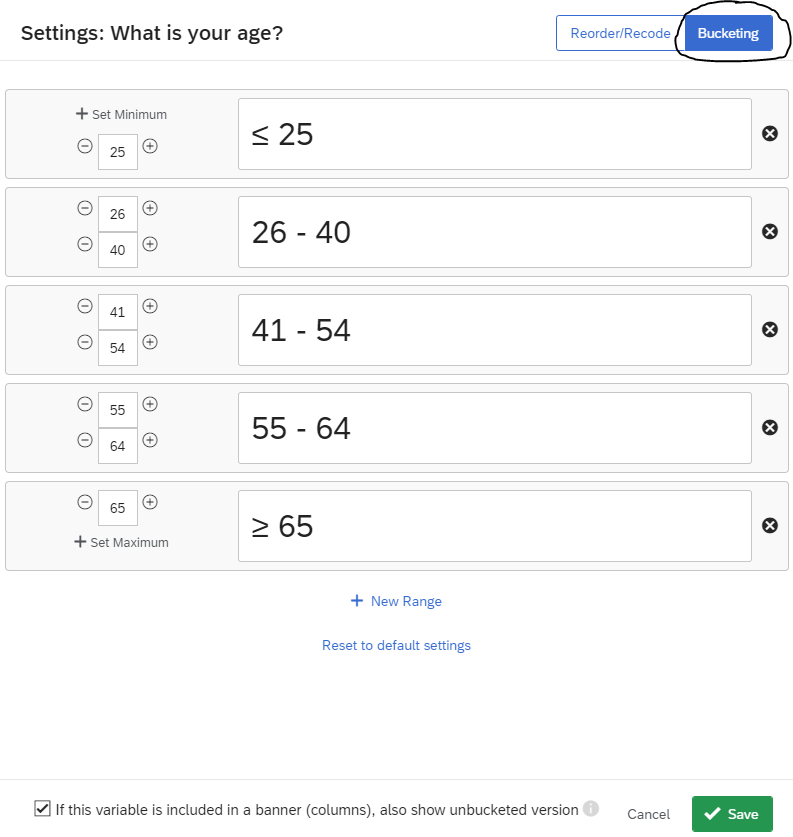
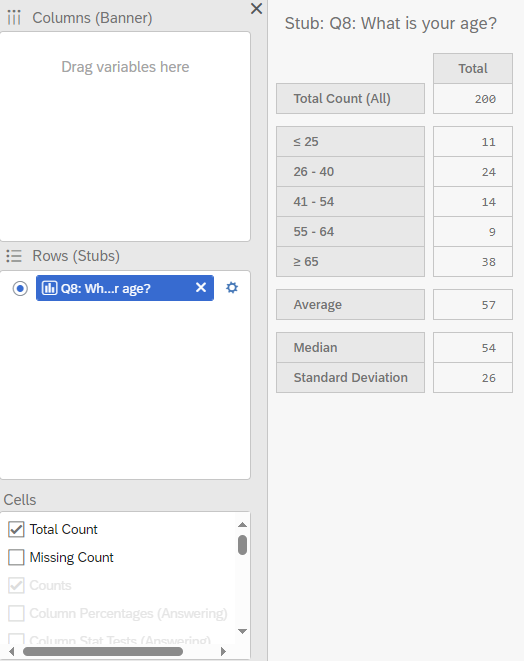
Now, the crosstab displays the buckets for age, while also computing the Average, Median, and Standard Deviation.
10.1.3 Categorical variables
To calculate descriptive statistics for a categorical variable, you can drag and drop a variable into the Rows (Stubs) pane. In the Cells pane, you can select which descriptive statistics you would like to calculate (e.g., count, column percentages, etc.). Being a categorical variable, statistics such as the mean, median, or standard deviation, are not possible to compute.
10.1.4 Bucketing Categorical Variables
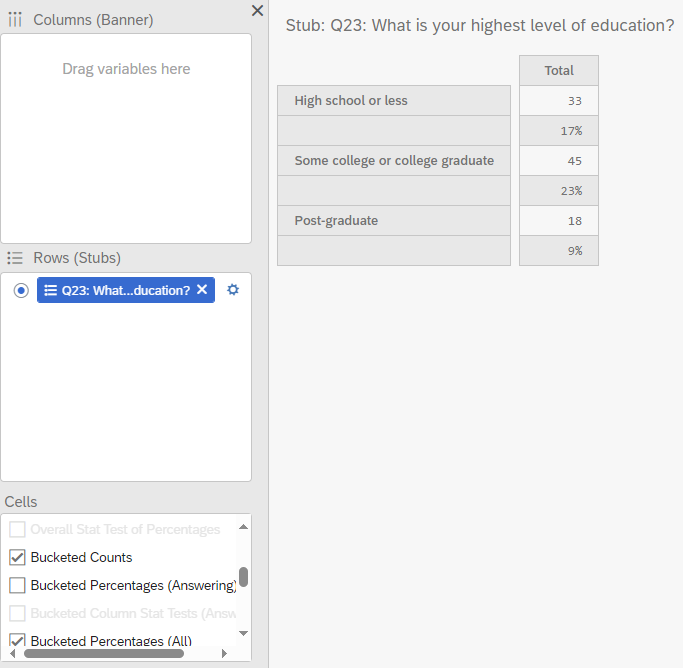
If you have a categorical variable whose values you would like to recode into new groups, you can choose to bucket the variable. For example, if you have a categorical variable for Education, but instead you would like to analyse fewer groups, you can bucket the values into different education groups.
To do so, first select the Variable Settings (gear icon). Next, select Bucketing and set the buckets for the variable. I have also selected the checkbox If this variable is included in a banner (columns), also show unbucketed version. By default, the bucketed version is shown in the banner. Then, click save.
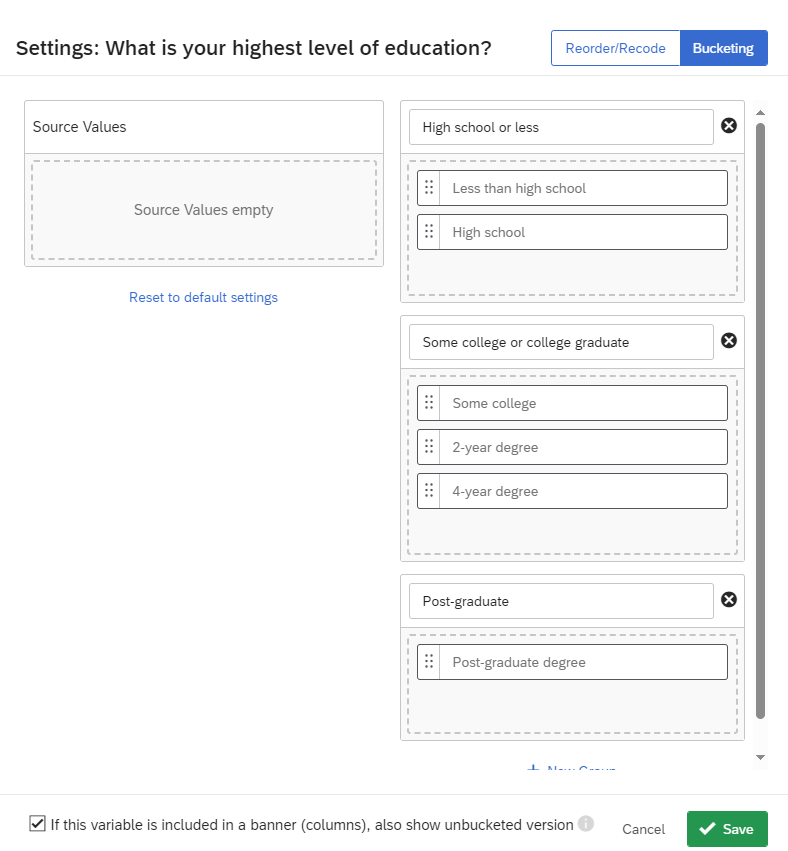
Now, the crosstab displays the buckets for education with the Bucketed Counts and Bucketed Percentages (All).
10.1.5 Crossabs
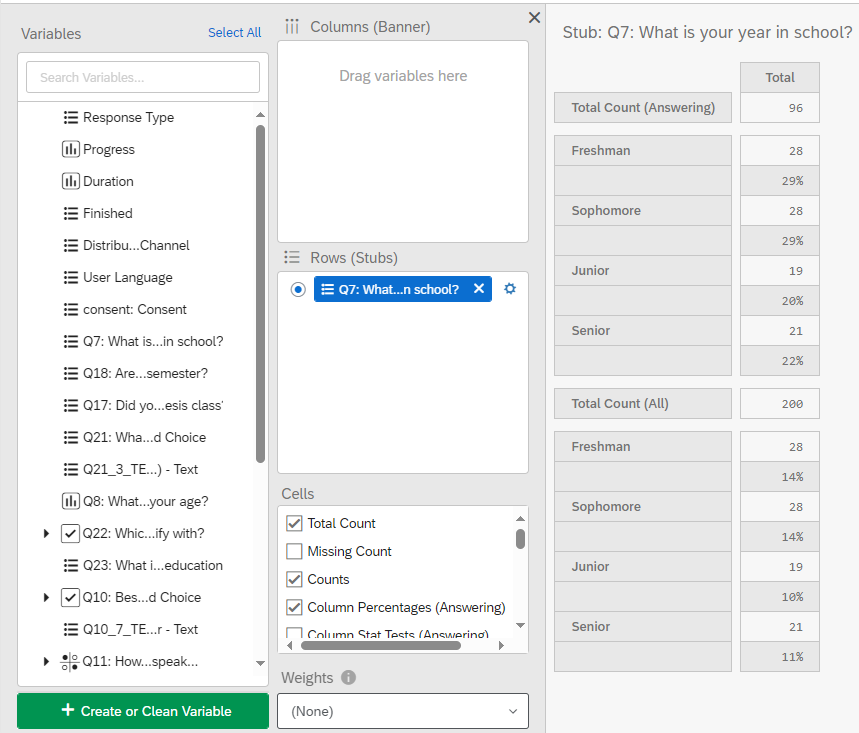
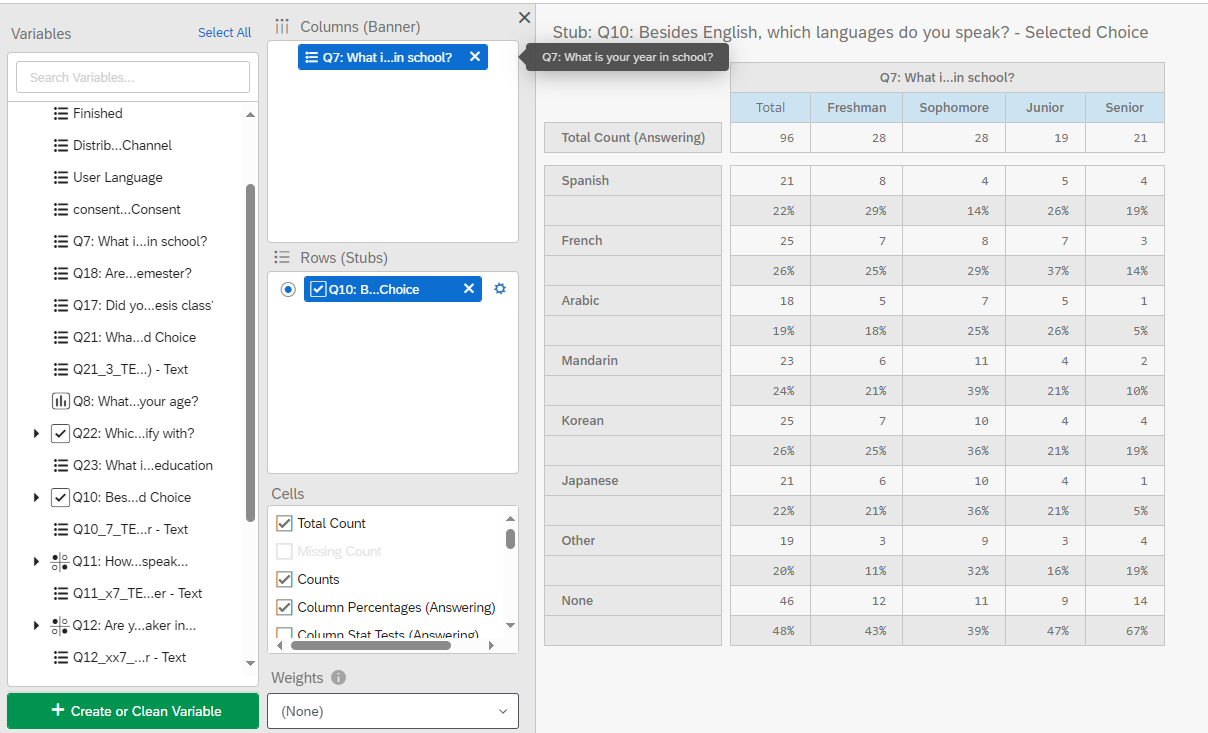
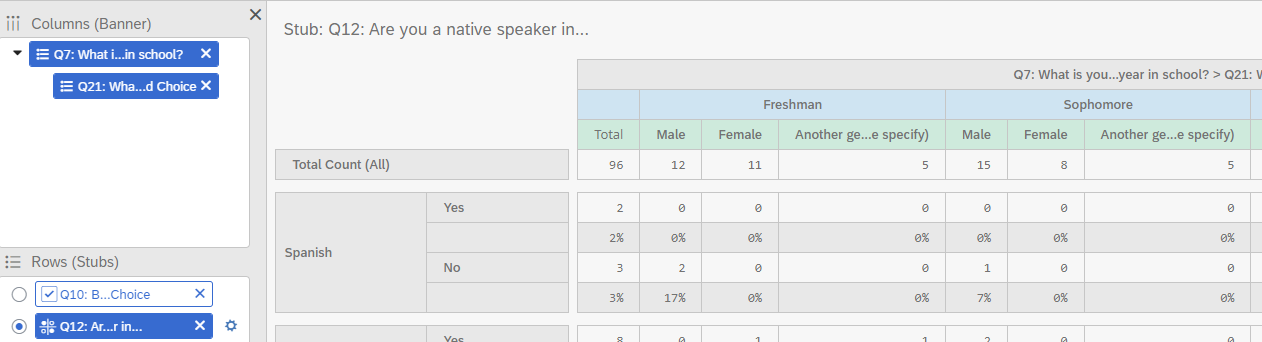
To generate a crosstab, drag your independent variable and drop it in the Columns (Banners) pane and then drag and drop your dependent variable in the Rows (Stubs) pane. For example, in Figure 13, I have selected the Year in School variable as my categorical independent variable and placed it under Column (Banner) and as my categorical dependent variable, I have selected the Languages variable. In my cross tab, I have generated the counts, total counts, and the column percentages (answering).
10.1.5.1 Counts
There are four types of counts you can calculate. - The Total Count generates the number of people (frequency) who responded to both the column and row questions. - The Missing Count shows the number of people who did not answer a given row question (who did answer the column question). - The Counts shows the number of people who answered in a given column category for the question in the row. - The Bucketed Counts shows the number of people from each category of the column variable that fit into each bucket in the row variable.
10.1.5.2 Percentages
There are three types of column percentages you can calculate. - The Column Percentages (Answering) calculates the percentages in each column category that gave each answer in the selected row. This is calculated using the total number of answers provided to the question, instead of total respondents. - The Column Percentages (All) calculates the percentages based on the total number of respondents to the survey. - The Bucketed Percentages (All) calculates the percentages based on those in each column category that fits into a particular bucket in the dependent variable (only if buckets are generated for this variable). This percentages is generated based on the total number of respondents to the survey.
You can add multiple variables in your columns and rows. However, you cannot view all the calculations for values added to the row all at once. For each variable you add, in your column, you can view the crosstab side-by-side.
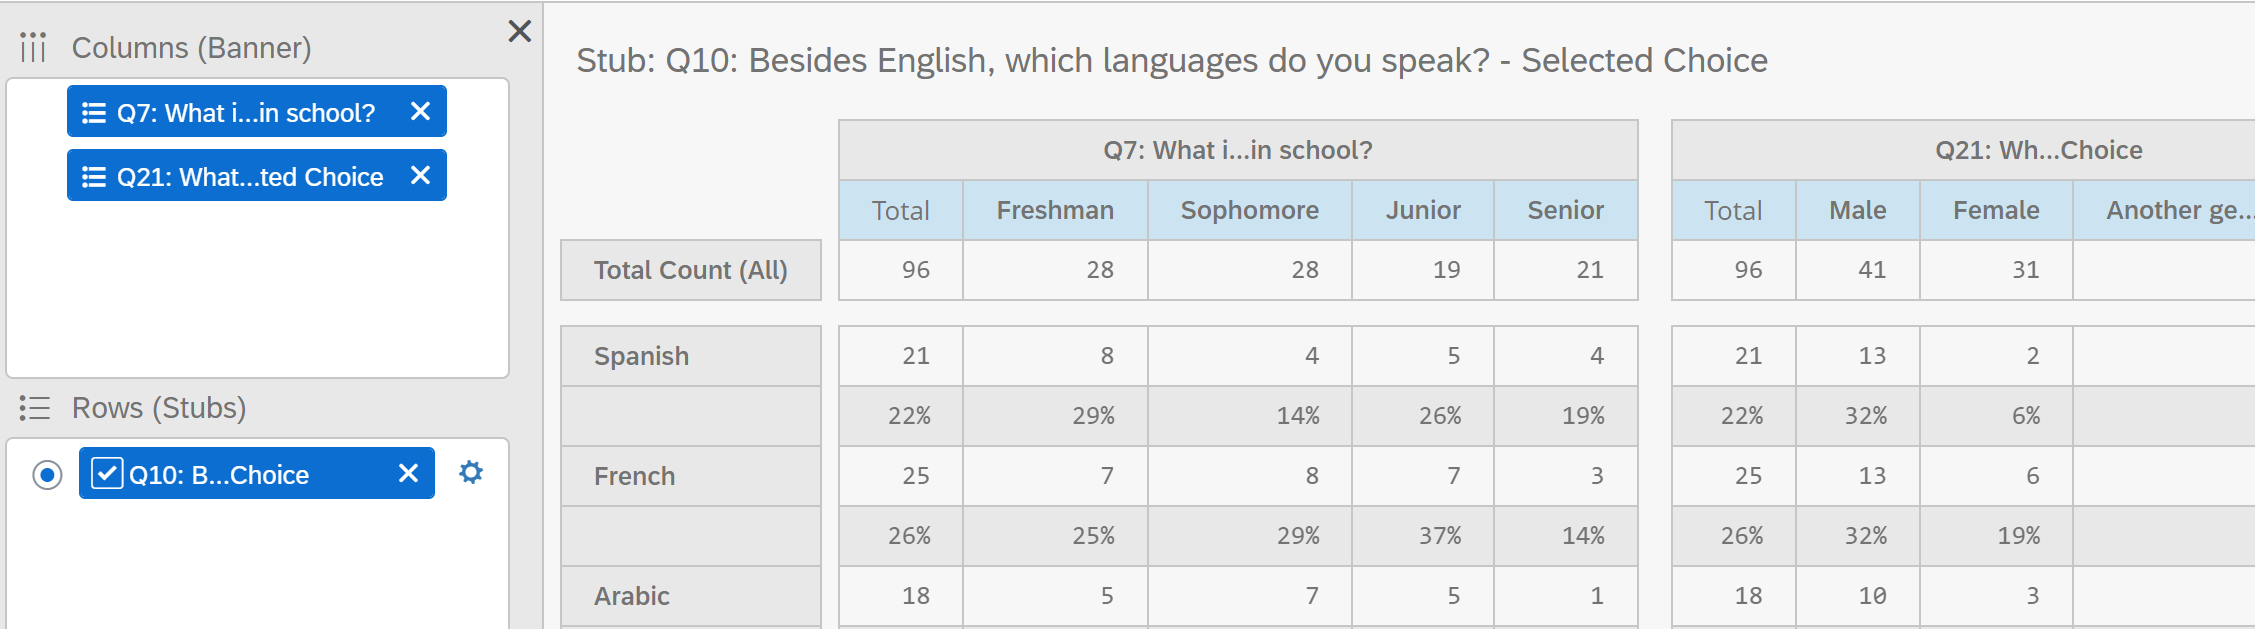
If you add multiple variables to your row, you can only generate the table for one variable at a time. You must select the row variable to generate a table.
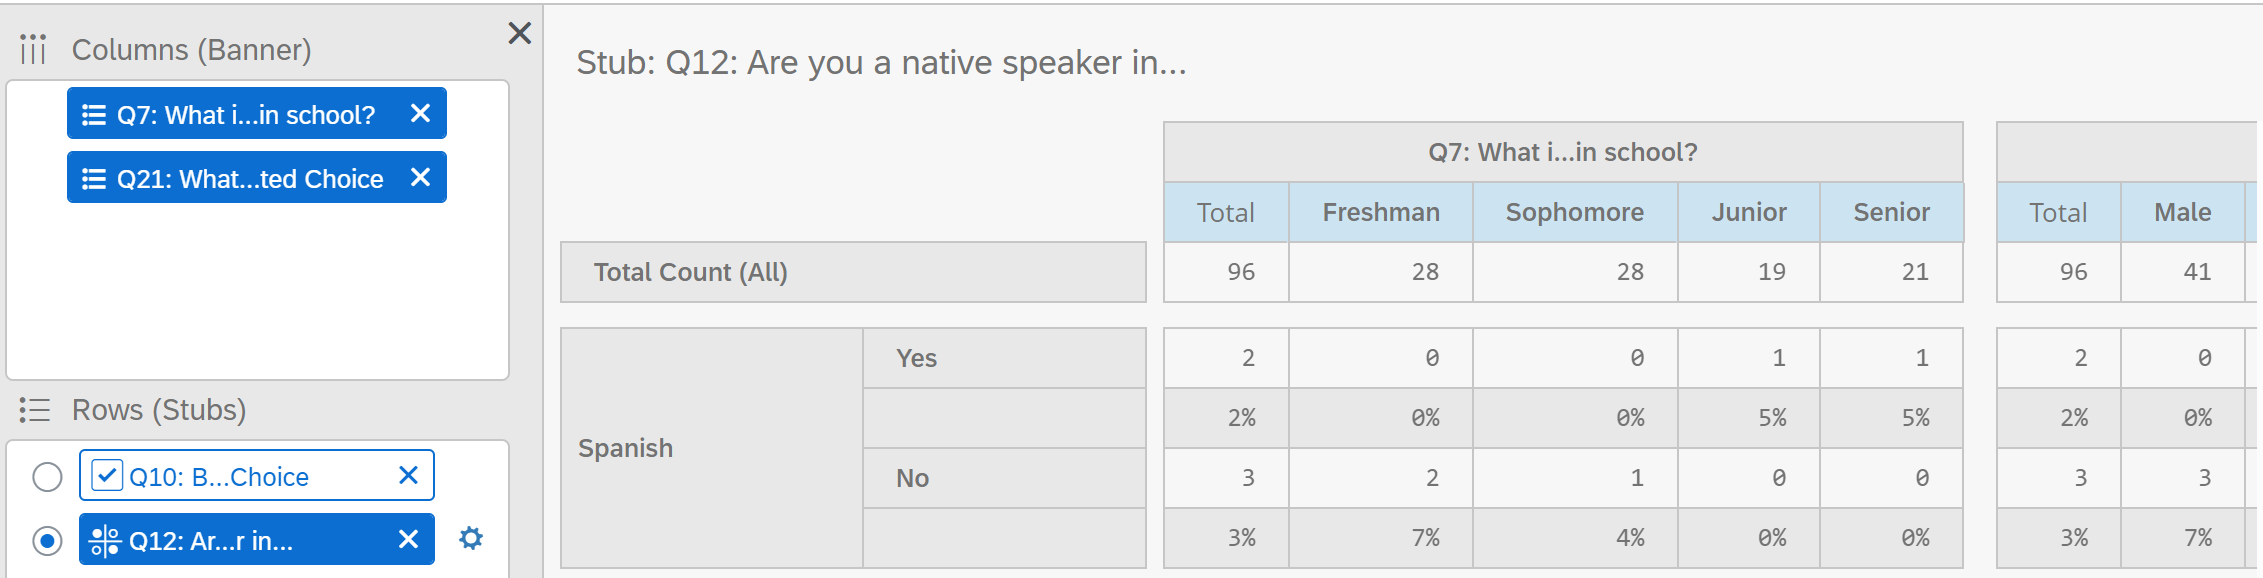
10.2 Nesting
If you would like to view a breakdown of a variable within another variable, you can use nesting. Only columns can be nested, not rows. To nest a variable, first add your variable under columns and then drag your second variable over the first one. If successfully nested, the second variable should appear indented under the first variable. In Figure 17, gender is nested within Year in School.
10.3 Chi-Squared Test
To examine the relationship between two categorical variables, you can choose a chi-squared test. To do so, you must select the Column Percentages (All) and the Overall Stats Test of Percentages. The Overall Stats Test of Percentages acts as a Chi-squared test, which produces a p-value to determine whether the relationship between the two variables is significant or not.
As shown in Figure 18, I have selected Year in School as my categorical independent variable and Language Fluency as my categorical dependent variable to generate my crosstab. In this crosstab, I display the total count, count, and column percentages.
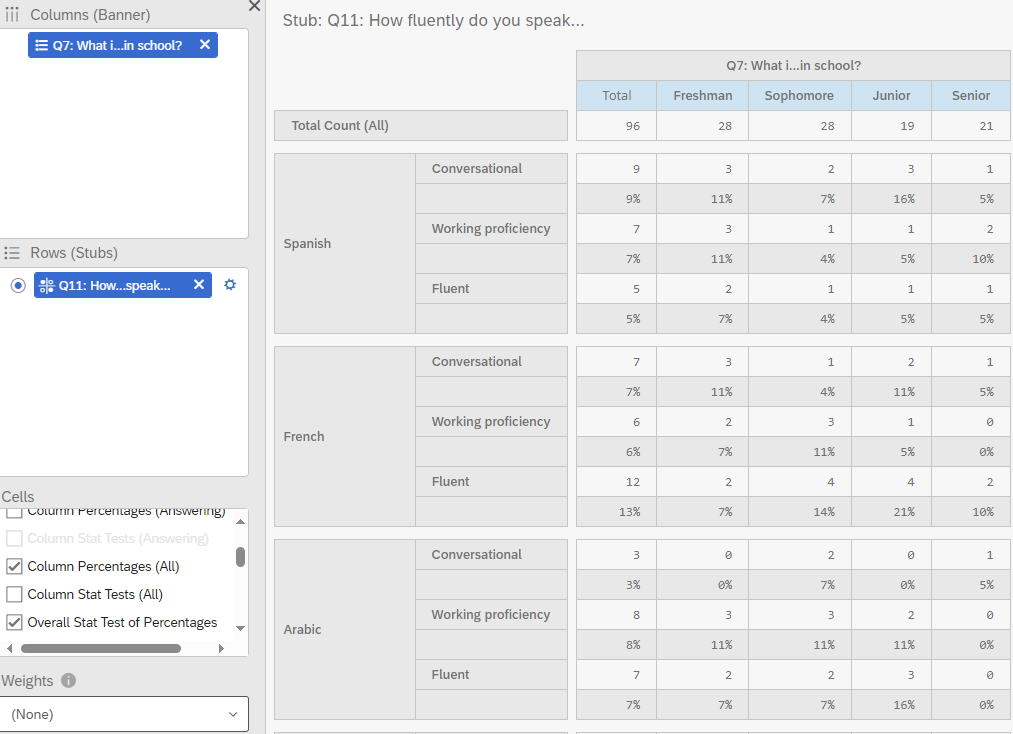
To perform the chi-squared test, I also selected the Overall Stats Test of Percentages. This generates a table that indicates whether the p-values are below 0.05. As shown in the table, none of the values are less than 0.05, therefore there is no statistically significant relationship between these variables.
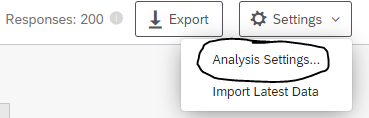
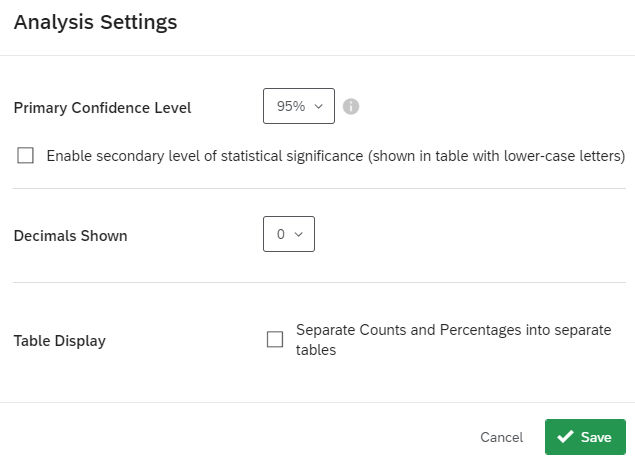
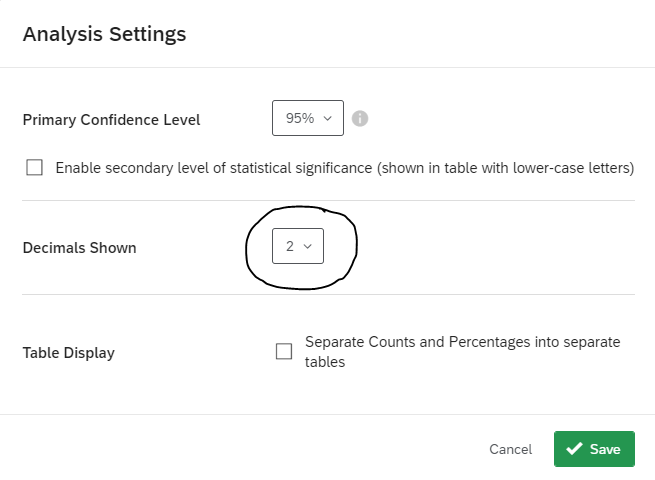
By default, the primary confidence level is set at 95%, but this can be changed in the Analysis Settings, as shown in Figure 20 and 21. You can also change the number of decimals shown and separate counts and percentages into separate tables.
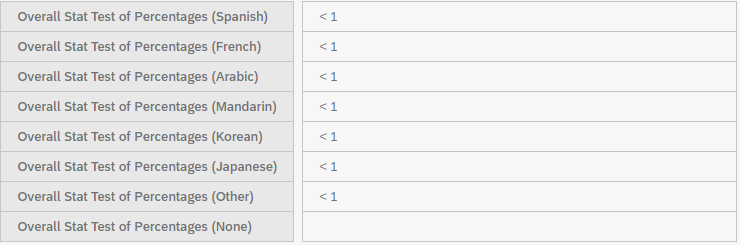
If you would like to see the precise p-values instead of “< 1”, you must change the variable settings to show at least one decimal point.
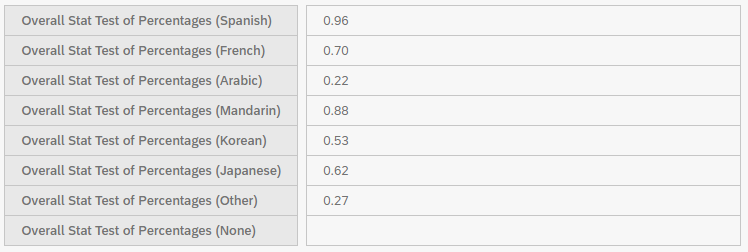
Please note that in Crosstabs iQ, Chi-Square values are not displayed. The analysis only displays the p-values and whether there is a statistically significant relationship between the variables (bolded). In Figure 23, none of the relationships are statistically significant.
10.4 Analysis of Variance (ANOVA) Test
To test whether the differences in means between one or more categorical independent variables and a normally distributed continuous (i.e. interval or ratio) dependent variable is significant, you can choose an analysis of variance (ANOVA) test. To do so, you must select Averages and the Overall Stat Test of Averages
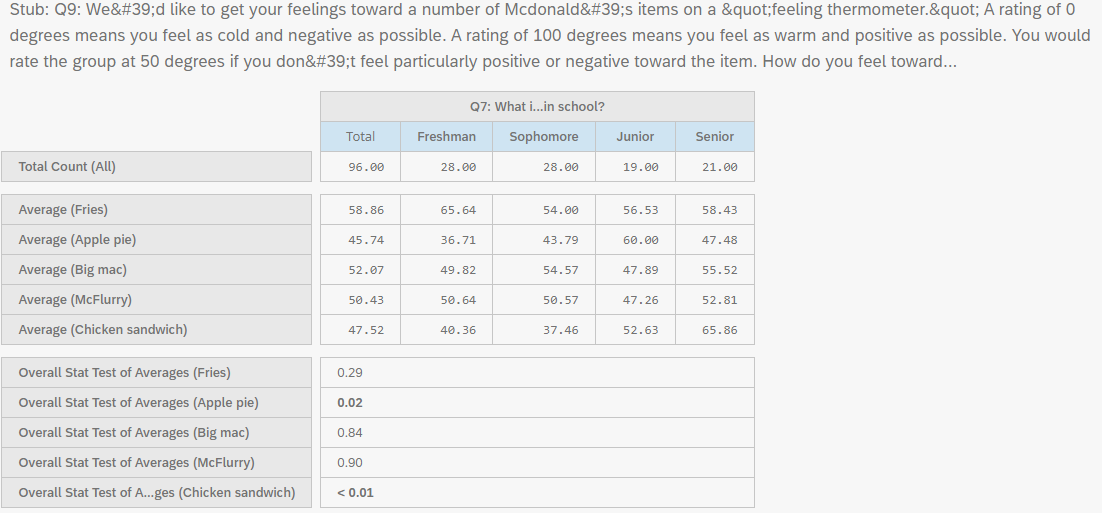
As shown in Figure 24, there is a significant relationship between Year in School and feelings toward Apple Pie and Chicken Sandwich (bolded p-values).
10.5 Z-Tests
If you would like to determine whether two samples are different from one another, you may use a Z-test. Z-tests are similar to t-tests but z-tests are more common where the sample size is larger (generally over 30). Z- and t-test results converge as the sample size approaches infinity (i.e., or at about a sample of 120). Z-tests require you to know the population standard deviation, while t-tests use a sample estimate of the standard deviation. If your sample size is less than 25, please be aware that your p-value from a z-test may be slightly different than a t-test. Z-tests are sensitive to mean differences in smaller samples and can produce statistically significant results incorrectly (i.e., a type 1 error or false positive). When you have a sample estimate of the standard deviation, which is most of the time, the best statistical practice is to use a t-test regardless of the sample size. T-tests tend to be more conservative than z-tests and therefore are generally recommended.
To perform a pairwise z-test, you must select Averages and Stat Test of Column Averages. Please note that your outcome or dependent variable must be numeric.
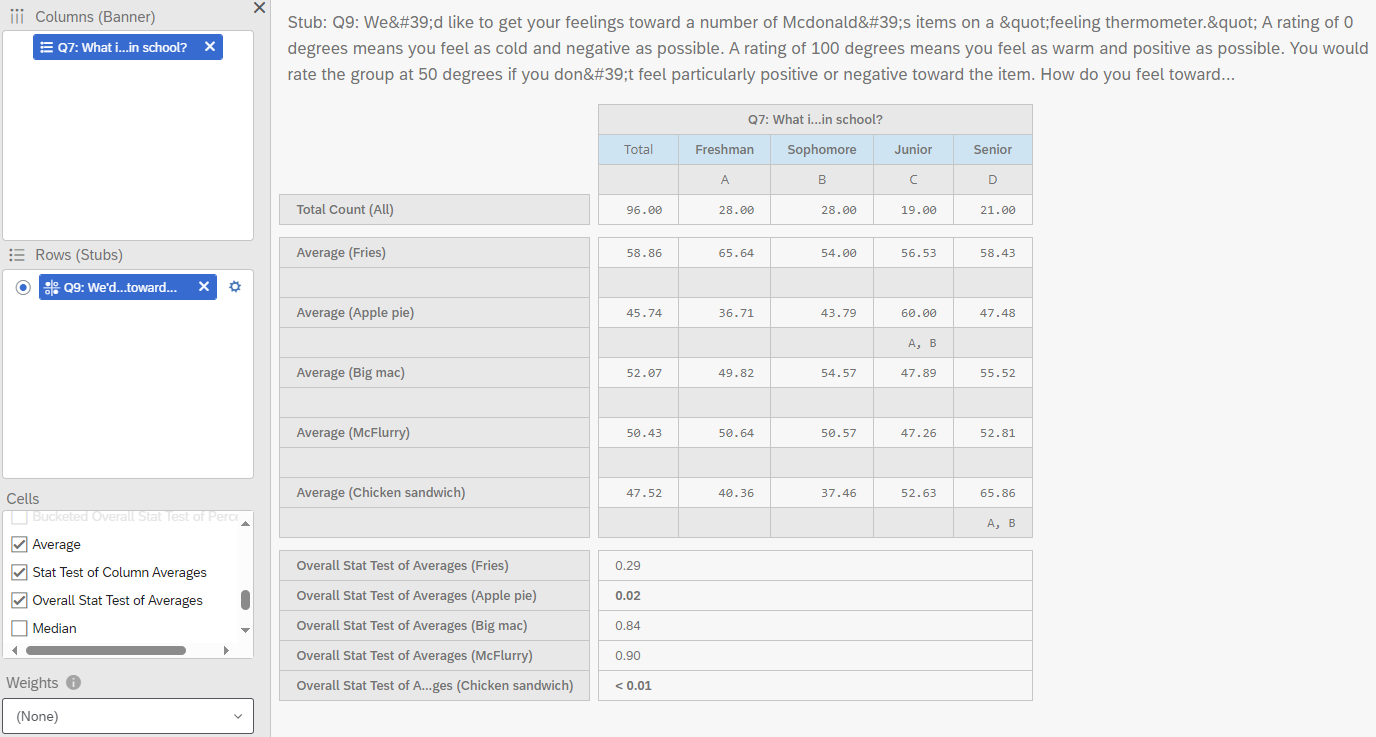
Below the column averages, letters appear in some of the columns. These letters indicate which columns are significantly different from the given column. For example, in column C, Juniors have significantly higher feelings (more positive feelings) toward McDonald’s apple pie compared to Freshmen (column A) and Sophomores (column B).
For more on Crosstabs iQ: - Crosstabs Overview - Crosstabs Options - Understanding Crosstabs Statistics