7 Data Analysis Overview
This guide is a work in progress, and will be updated substantially as time allows. If you find an error, please let us know.
In the Data & Analysis tab in Qualtrics, you can filter, classify, merge, clean, and analyze your data.
As part of the University of Illinois Qualtrics license, you should have access to the following tabs:
- Data: for filtering, classifying, merging, importing, and cleaning data
- Text iQ: for tagging text entry responses (i.e., open-ended responses) with topics for analysis
- Stats iQ: for performing statistical analyses on your data
- Crosstabs iQ: for performing multivariate analyses (i.e., analyzing two or more variables at a time)
- Weighting: for generating weights (i.e., raked or interlocked) for your data
This guide provides an overview of options for performing statistical analyses in Qualtrics, but please use caution when interpreting the results. Be sure that you have selected the appropriate statistical test for your data and have checked that your data has met the assumptions for that test. Please see Test Options or email us for a consultation if you are unsure what test to use.
7.1 Quantitative and Qualitative Data
In Qualtrics, you can collect both quantitative and qualitative data.
Qualitative data is a type of descriptive data and is typically unstructured. For example, in Qualtrics, you can collect open-ended responses to survey questions (e.g., ask respondents to provide feedback) or text-entry data (e.g., provide another answer to a multiple choice question).
Quantitative data is data that can be assigned a numerical value and can be used for statistical analysis. For example, multiple choice questions or yes/no questions that can have categories with assigned numeric values (e.g., race, voter registration status, political party, or agree/disagree questions).
Depending on the type of data you collect, you may approach the analysis of the data differently.
7.2 Descriptive Data Analysis
One approach to understanding your data is by performing descriptive data analysis. Descriptive analyses typically involve understanding patterns or characteristics in the data.
For example, if you were interested in understanding language fluency among college students, you may field a survey that asked a variety of questions involving the number of languages spoken, nativity, and fluency. To understand patterns in languages spoken, you may choose to calculate frequency tables (i.e., a type of descriptive analysis) to understand how many respondents speak a given list of languages. Moreover, you can create cross-tabulations (or, cross-tabs) to understand languages spoken by year in college. By generating this descriptive data, you can explore whether the number of languages spoken increases by year in college, or perhaps, the level of fluency in a given languages increases by year in college. This descriptive analysis can help discover patterns in the data before performing any statistical analyses.
As part of descriptive data analysis, you can generate descriptive statistics such as:
- Measures of central tendency
- Mean: The average (the sum of items divided by the number of items).
- Median: The middle-most observation after organizing data in an ascending order.
- Mode: The value that appears most frequently in the data.
- Measures of variability
- Range: The spread of the data from the lowest to the highest value in the distribution (subtract the data’s lowest and highest values).
- Variance: The average squared departures from the mean.
- Standard Deviation: The average level of variability in the data .
7.3 Inferential Statistics
Another approach to understanding your data is by performing statistical inference, or inferring properties about a population. As part of inferential statistics, researchers aim to generalize their findings from the sample to the population in question and generate hypotheses about the population based on the sample.
As part of inferential statistics, you can do hypothesis testing, regression analysis, or generate confidence intervals.
- Confidence intervals: This provides a range of values in which the true population parameter (e.g., means) is likely to fall given a certain level of confidence (e.g., 95%). Confidence intervals represent the uncertainty of model predictions or parameter estimates.
- Hypothesis testing: This is a statistical method used to test assumptions or claims about a population parameter, commonly used when evaluating the significance of results.
- Null hypothesis (H0): There is no effect (e.g., of x on y) or difference (e.g., between a and b).
- Alternative hypothesis (H1): There is an effect (e.g., of x on y) or difference (e.g., between a and b).
- P-value: The p-value is the probability of observing a sample statistic that is at least as extreme as your sample statistic, given that the null hypothesis is true. In other words, it measures the likelihood of obtaining the observed data under the null hypothesis or how likely it is that the observed data would have occurred by random chance. The level of statistical significance is a p-value between 0 and 1. A common threshold to determine statistical significance (i.e., reject the null hypothesis) <= 0.05, though some disciplines might use 0.1.
Inferential statistics involves making inferences about a population based on a sample of data. Given the use of sample data, there is the possibility of error. There are two types of errors: Type I Error or Type II Error.
- Type I Error (False Positive)
A Type I error occurs when we reject the null hypothesis (H0) even though it is actually true (this is called a false positive).
- Type II Error (False Negative)
A Type II error occurs when we fail to reject the null hypothesis (H0) even though it is actually false (this is called a false negative).
7.4 Unsure of which test to use?
Here are a list of statistical procedures, depending on which question you are interested in.
| Shape of the data | Comparing Unrelated Groups | Comparing Related/Paired Groups |
|---|---|---|
| Normally distributed, with homogeneous variance | Independent samples T-Test | Paired T-Test |
| Normally distributed, with unequal variances | Mann-Whitney U Test | Wilcoxon Rank Test |
| Non-normally distributed | Welch Test | (none) |
For a comparison of proportions between two categorical variables, use a Chi-Square test. However, if both variables have two categories and the excpected cell counts are less than 5, use Fisher’s Exact Test instead.
| Type of Dependent Variable | 1 Independent Variable | 2+ Independent Variables |
|---|---|---|
| Continuous | Bivariate Regression | Multiple Regression |
| Ordinal | Ordinal Regression | (Multiple) Ordinal Regression |
| Binary (0/1) | Logistic Regression | (Multiple) Logistic Regression |
| Nominal/Categorical | Multinomial Logistic Regression | Multinomial Logistic Regression |
| 2+ Dependent Variables (Continuous) | OLS Regression / Multivariate Regression | Multivariate Multiple Regression |
| Dependent Variables | 1 Independent Variable | 2+ Independent Variables |
|---|---|---|
| 1 | One-way ANOVA | Two-way or Factorial (Three-way) ANOVA |
| 2+ | One-way MANOVA | Two-way or Factorial (Three-way) MANOVA |
| Dependent Variables | 1 Independent Variable | 2+ Independent Variables |
|---|---|---|
| 1 | Repeated One-way ANOVA | Two-way or Factorial (Three-way) ANOVA |
| 2+ | One-way MANOVA | Two-way or Factorial (Three-way) MANOVA |
| Dependent Variables | 1 Independent Variable | 2+ Independent Variables |
|---|---|---|
| 1 | One-way ANCOVA | Two-way or Factorial (Three-way) ANCOVA |
| 2+ | One-way MANCOVA | Multiple MANCOVA |
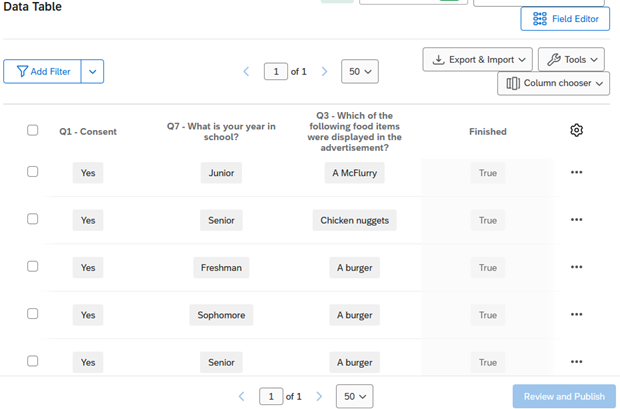
7.5 Data
In the Data tab, you can view your data table. This Data Table will show you a select number of columns and rows. The Data Table will also inform you of how many responses you have recorded and how many responses are currently in progress.
In the Data Table, you can filter data by survey metadata, contact fields, embedded data, or by specific questions.
7.6 Text iQ
In your survey, you may choose to include open-ended or text entry responses. To analyze text responses (i.e., open-ended question data) from your surveys, you can use Qualtrics’ Text iQ tool. The Text iQ tool allows you to search and assign topics to your data (20,000 responses per survey limit). Please note that sentiment analysis and building widgets are not available with the current Qualtrics license.
Performing text analysis involves making sense of text data by classifying or extracting information and identifying patterns or themes within the data. Topics are one way to classify or group similar themes in the data. Topics are then added to your data for export, if you wish to do additional analysis.
Certain Text iQ data (i.e., topics, parent topics, topic hierarchy level fields) are available for use in Stats iQ. You may analyze these Text iQ variables (e.g., describe, relate, regression, etc.) as you would use other variables.
See (Chapter 9) for guidance on how to analyze your open-ended responses using Text iQ.
7.7 Stats iQ
In Stats iQ, you can perform the following analyses:
- T-test (2 Categories vs. Numbers)
- ANOVA (3+ Categories vs. Numbers)
- Games-Howell post hoc tests (3+ Categories vs. Numbers)
- Cohen’s f
- Correlation (Numbers vs. Numbers)
- Pearson correlation
- Spearman correlation
- Point Biserial correlation
- Cohen’s d
- Paired t-test (Numbers vs. Numbers)
- Fisher’s Exact Test (2 Categories vs. 2 Categories)
- Chi-squared (3+ Categories vs. Categories)
- Cramer’s V
- Z-test (Categories vs. Categories)
- Time-series analysis
- Difference in differences (DID, DD)
- Linear regression (OLS, M-estimation, Ridge)
- Logistic/logit regression
See (Chapter 8) for guidance on how to analyze your data using Stats iQ.
7.8 Crosstabs iQ
In Crosstabs iQ, you can create a cross tabulation (crosstab), a data table that compares the relationship between two or more categorical variables. A crosstab can be used to generate the frequency or proportion of respondents that fall into a particular row/column.
Qualtrics provides the Crosstab iQ tab that allows you to perform multivariate analysis on two or more variables, including z-tests, chi-square and analysis of variance (ANOVA) tests.
See (Chapter 10) for guidance on how to analyze your data using Crosstabs iQ.
7.9 Weighting
This section is a work in progress.